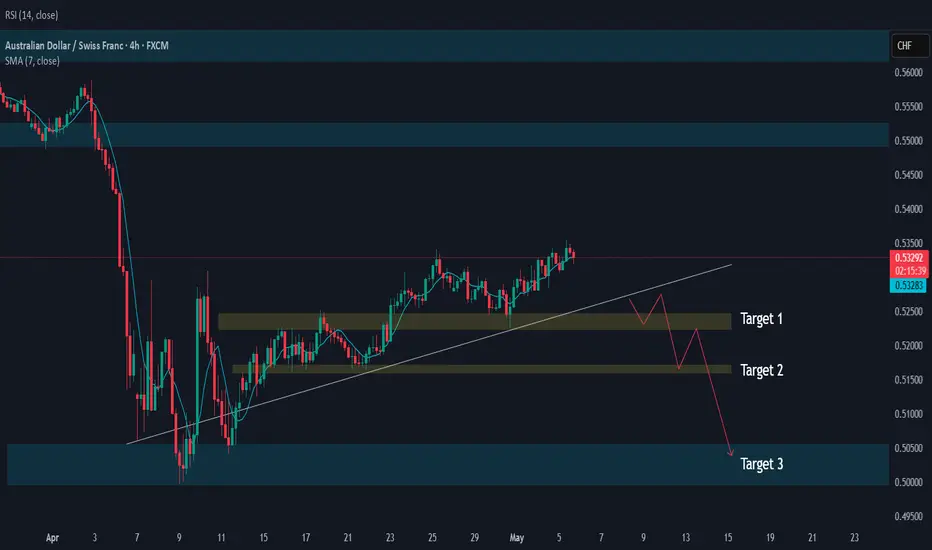
According to the AUDCHF chart it's obvious to us it has been on a downward trend to date.

So it's logical to looking for a sell position.
We have a trendline on the chart and before it, we had a powerful bearish trend. These form a flag pattern for us.
After breaking the trendline with a strong candle at 4H timeframe we can expect another bearish leg.
And our targets is the trendline collisions. (0.52479-0.52225) & (0.51731 - 0.51587)
And our last target is the daily support level. (0.50568 - 0.49949)
After that our scenario happen I'll update my analysis.
It's just my personal analysis and I have no responsibility for your trades. thanks for your attention.
Disclaimer
The information and publications are not meant to be, and do not constitute, financial, investment, trading, or other types of advice or recommendations supplied or endorsed by TradingView. Read more in the Terms of Use.
Disclaimer
The information and publications are not meant to be, and do not constitute, financial, investment, trading, or other types of advice or recommendations supplied or endorsed by TradingView. Read more in the Terms of Use.