On Monthly, it made a Doji and pulling back down.
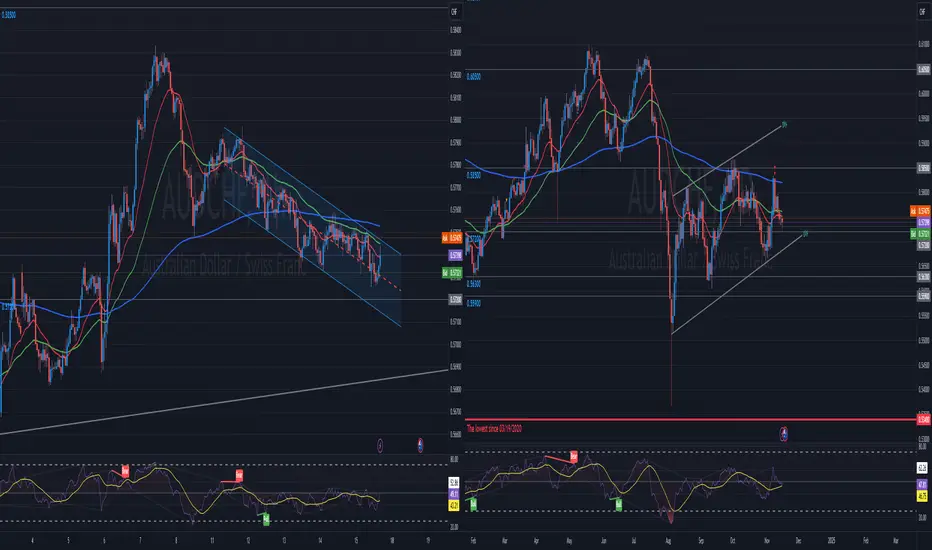
On Weekly, price is below 200, 50, and 20 EMA in the Rising Wedge formation.
On Daily, price is below 200, 50 and 20 EMA and hiting 0.57200 Psychological Support.
On 1H chart, price is below 200 EMA and it's hiting 50 EMA and upper trendline.
Overall, they are all showing continuation of Bearish move. I would watch 0.057200 Support to break and go Bearish.
Disclaimer
The information and publications are not meant to be, and do not constitute, financial, investment, trading, or other types of advice or recommendations supplied or endorsed by TradingView. Read more in the Terms of Use.
Disclaimer
The information and publications are not meant to be, and do not constitute, financial, investment, trading, or other types of advice or recommendations supplied or endorsed by TradingView. Read more in the Terms of Use.