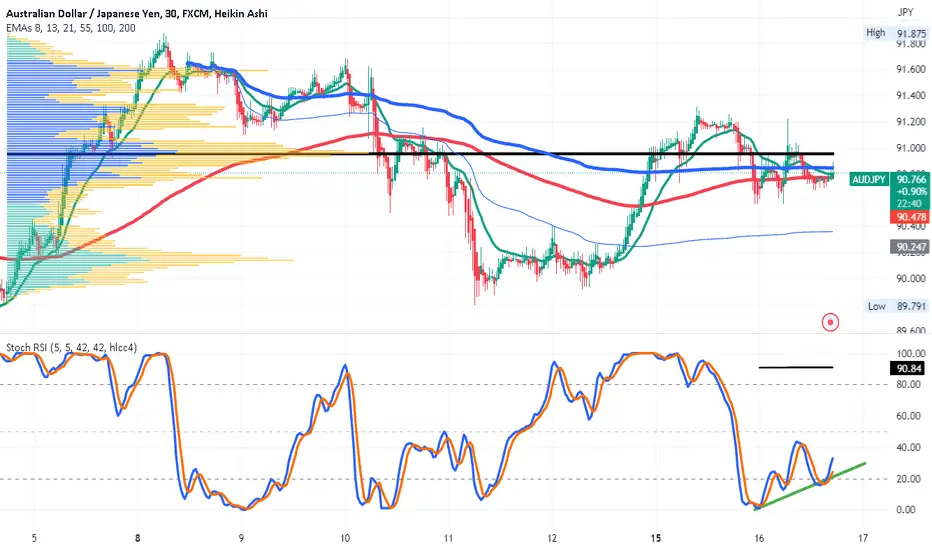
AUDJPY on the 30-minute chart has had higher lows but also lower highs and may have
a symmetrical triangle pattern. Price is currently at or above the following :
(1) the POC line of the long-term volume profile (2) the mean line of the long-term anchored
VWAP (blue line ) and the convergence of the EMA 200 ( red) and EMA 21 ( green). On the
stochastic RSI the lines are moving upward from a bottom well below 20 and suggest bullish
divergence. Given these confluences, I conclude that AUDJPY is set up to move higher over
the intermediate term.
Trade active
AUDJPY had a nice 0.7% price rise today- far better leveraged on forex. Open position for tomorrow.Trade active
Price reaching for 92. Buy another lot.Disclaimer
The information and publications are not meant to be, and do not constitute, financial, investment, trading, or other types of advice or recommendations supplied or endorsed by TradingView. Read more in the Terms of Use.
Disclaimer
The information and publications are not meant to be, and do not constitute, financial, investment, trading, or other types of advice or recommendations supplied or endorsed by TradingView. Read more in the Terms of Use.