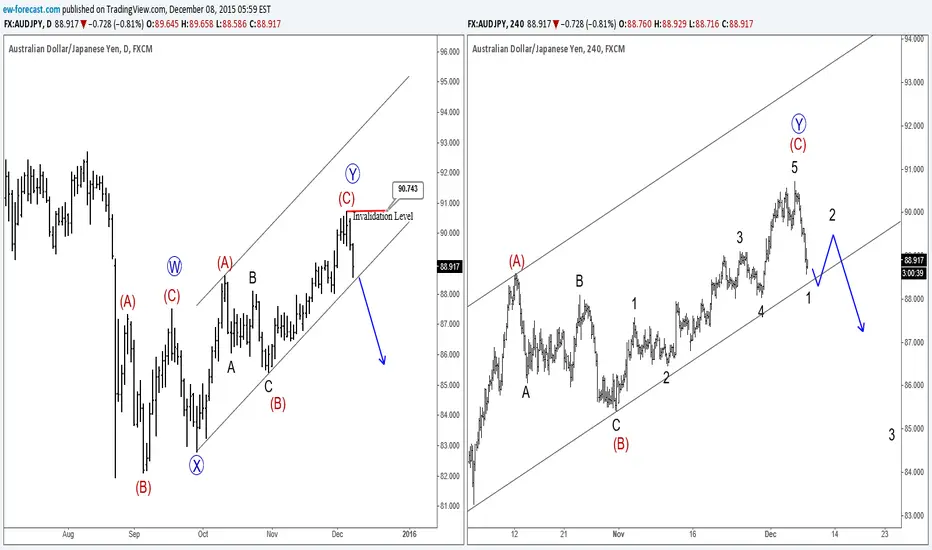
On the Daily chart of AUDJPY, we are tracking a double zig-zag pattern, that consist of waves W-X-Y with sub-waves a-b-c. As we see on the chart, recent reversal to the downside form 90.743 level, where we labeled end of wave (C) could suggest that price may be facing lower levels in session ahead. That said break beneath lower channel line would indicate more weakness.
ew-forecast.com
ew-forecast.com
US Single STOCKS (FREE Access), FX, Crypto
👉Explore Our Services @ wavetraders.com/elliott-wave-plans/
Learn Elliott Waves
👉 wavetraders.com/academy/
Newsletter Sign up
👉 bit.ly/3FVPVzO
👉Explore Our Services @ wavetraders.com/elliott-wave-plans/
Learn Elliott Waves
👉 wavetraders.com/academy/
Newsletter Sign up
👉 bit.ly/3FVPVzO
Disclaimer
The information and publications are not meant to be, and do not constitute, financial, investment, trading, or other types of advice or recommendations supplied or endorsed by TradingView. Read more in the Terms of Use.