The Trend Strength Index (TSI) indicators are deep in oversold territory:
TSI(10): -0.83
TSI(20): -0.86
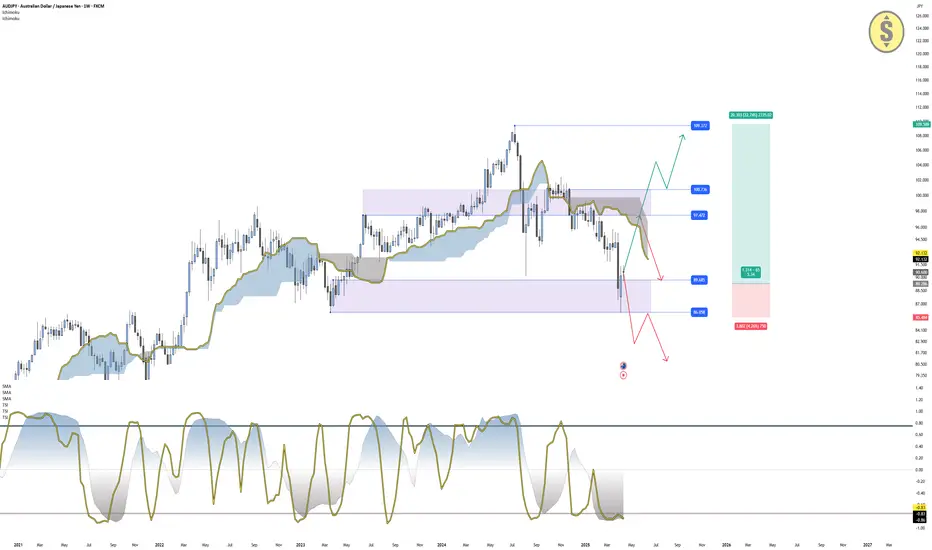
This signals that bearish momentum is weakening, and a bounce is likely if the support zone continues to hold. The market could now aim to retest the 97.47 – 100.73 resistance area, which aligns with the cloud base and recent structural highs.
A bullish breakout above 100.73 would confirm a continuation of the bullish trend, with a potential new higher high toward 109.17 — the previous major swing high.
On the other hand, if price breaks below 86.00, the bullish structure would be invalidated, possibly marking the beginning of a trend reversal and opening the door for deeper declines.
Scenarios to Watch:
Bullish Continuation (If Support Holds)
Entry from: 89.00–86.00
Resistance/TP zone: 97.47 – 100.73
Break above 100.73 targets: 109.17
Structure remains bullish above 86.00
Bearish Breakdown
Break and close below 86.00 invalidates the bullish thesis
Retest of broken support may act as resistance
Lower lows expected if support fails
AUD/JPY is a cross driven by risk sentiment and yield differentials. The Reserve Bank of Australia has adopted a cautious stance, holding rates steady while keeping the door open for tightening if inflation picks up. Meanwhile, the Bank of Japan maintains an ultra-loose policy, though speculation about a slow shift toward normalization is growing. As a result, AUD/JPY remains sensitive to shifts in risk appetite and global yields. A continued risk-on environment would support AUD strength and help maintain the bullish structure — but any risk-off sentiment or sudden JPY strength could quickly shift the pair lower.
Disclaimer: This content is for educational and informational purposes only. It does not represent financial advice or a recommendation to buy or sell any financial instrument. Trading involves risk, and you should only trade with money you can afford to lose.
Trade forex, indices, stocks and metals with up to US$100.000 in company's funding.
Complete a challenge to access funding or go for instant deposit.
Trading involves substantial risk. Not financial advice
Complete a challenge to access funding or go for instant deposit.
Trading involves substantial risk. Not financial advice
Disclaimer
The information and publications are not meant to be, and do not constitute, financial, investment, trading, or other types of advice or recommendations supplied or endorsed by TradingView. Read more in the Terms of Use.