Based on the provided 4-hour chart of AUD/JPY, here is a brief summary and outlook.
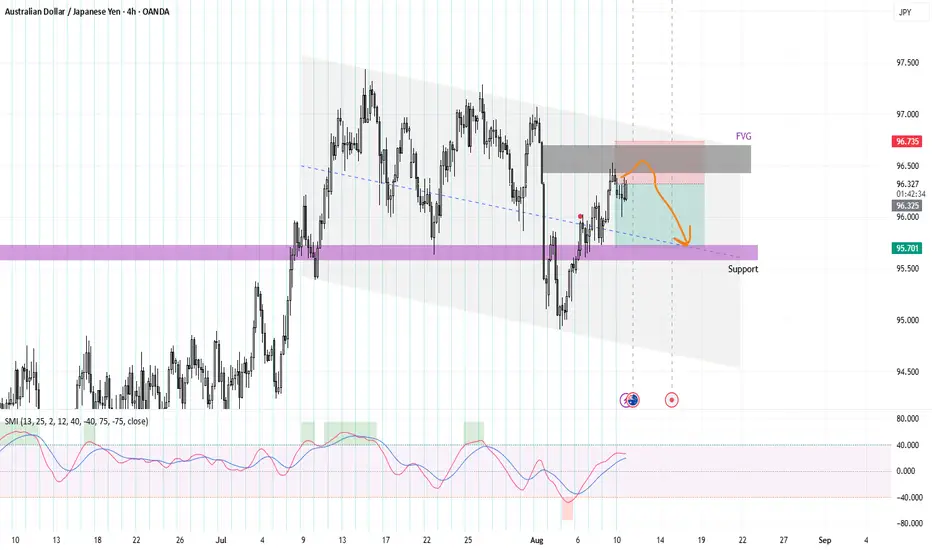
The AUD/JPY pair has recently been trading within a descending channel, as shown by the parallel trend lines. The price has just made a rally to the upper boundary of this channel, retesting a significant resistance zone. This resistance also coincides with a Fair Value Gap (FVG) area, which often acts as a point of price rejection. The Stochastic Momentum Index (SMI) in the lower panel is also showing an overbought condition, which further supports the potential for a reversal.
The chart illustrates a likely bearish scenario where the price is rejected at the current resistance level. The orange arrow depicts a potential movement where the price could fall back towards the support zone around 95.70. This support level has been significant in the past, acting as both resistance and support. A successful move to this level would be a continuation of the descending trend within the channel.
The expectation is for a bearish reversal from the current levels. Traders should look for confirmation of the rejection at the FVG and the channel's upper boundary. A successful break above the resistance at 96.73 would invalidate this bearish outlook. The key support level to watch for potential profit-taking is at 95.70.
Disclaimer
The information and publications are not meant to be, and do not constitute, financial, investment, trading, or other types of advice or recommendations supplied or endorsed by TradingView. Read more in the Terms of Use.
Disclaimer
The information and publications are not meant to be, and do not constitute, financial, investment, trading, or other types of advice or recommendations supplied or endorsed by TradingView. Read more in the Terms of Use.