Hello traders,
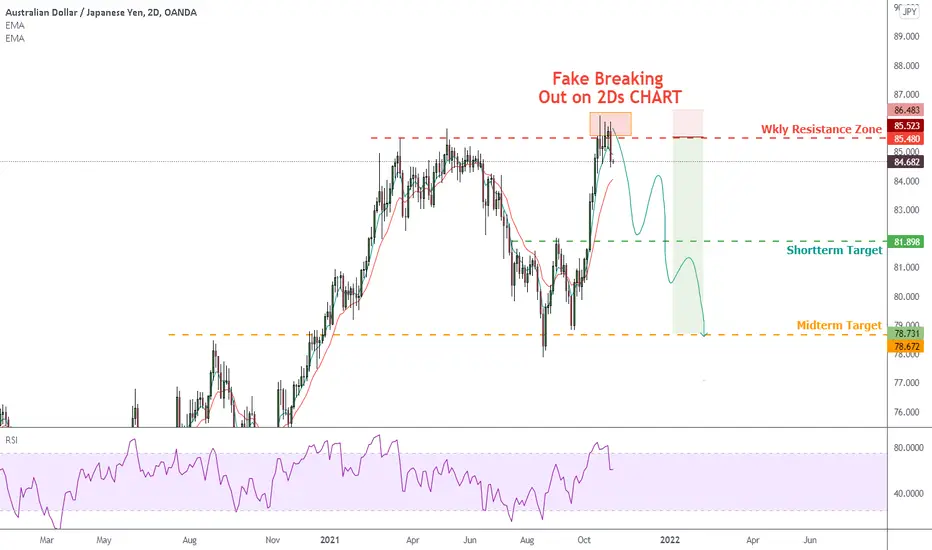
First of all, this is a 2Ds chart for AUDJPY.
All candles with some price positions higher than weekly resistance zone could b treated as fake breakingout on this chart becoz we got a strong bearish reversal pattern on 2Ds chart here.
So you need to find out a perfect entry to setup your trade to target the green dash line and the gold dash line down there for a potential TRADE WITH RR>7.
Very nice pair that you should list it on your watch list to sell this week.
GOOD LUCK!!!
LESS IS MORE!!
Join Free Telegram Group to get all the updates: t.me/FuntraderVera
Disclaimer
The information and publications are not meant to be, and do not constitute, financial, investment, trading, or other types of advice or recommendations supplied or endorsed by TradingView. Read more in the Terms of Use.
Join Free Telegram Group to get all the updates: t.me/FuntraderVera
Disclaimer
The information and publications are not meant to be, and do not constitute, financial, investment, trading, or other types of advice or recommendations supplied or endorsed by TradingView. Read more in the Terms of Use.