(Did this publishing on my mobile app.) On the Daily timeframe, a potential ABC pattern has been spotted. If you look left, the ABC pattern from the past is what I’m referring to. The RSI is overbought at this level and there is also a potential divergence being created between price and RSI. Buyers seem to still want to push but the effort in action seems like it’s gassing. Took an initial entry with a 1:1 setup and may start planning for an additional entry depending on price movement down the road. This is a weekly/ daily trade and will take some time. Not advice. If stop loss gets hit, we will reassess.
Note
Looks like price has retraced a bout 20% relative to the fib retracement. Want to see if more sellers come in. You can still see the divergence on this Daily timeframe so I'm not sure if we are done yet. Gonna stay patient and let the trade work win or lose.
Note
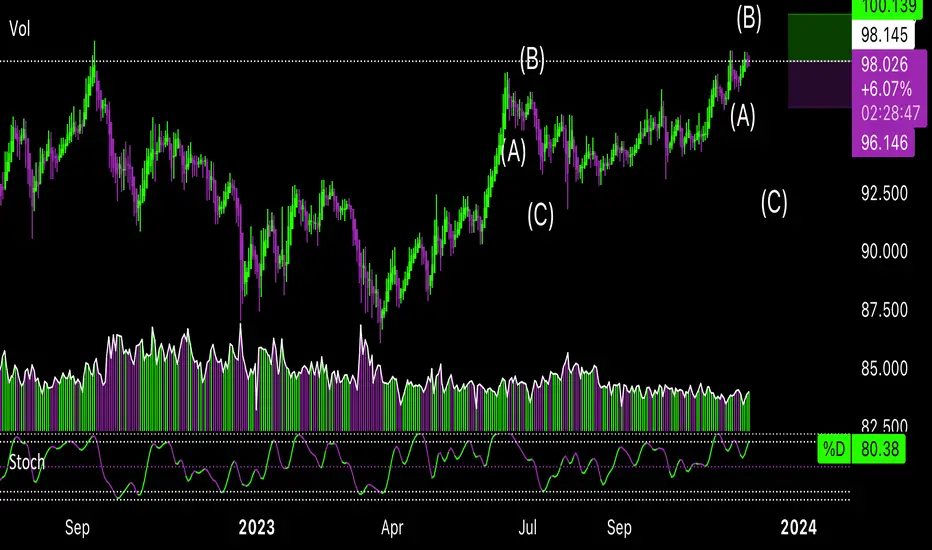
Readjusted targets for the 4 hour timeframe. I took a partial profit from the recent trade posted above at the first target level (in photos above not this one). Also added another position near this price level since price edged up a bit. Looking for price to reach anywhere between 97.667-97.207 or more at some point. If not, its all good. Potential "ABC" pattern forming? Price could also break the resistance level and if it does, we will assess further if there is another opportunity.
Disclaimer
The information and publications are not meant to be, and do not constitute, financial, investment, trading, or other types of advice or recommendations supplied or endorsed by TradingView. Read more in the Terms of Use.
Disclaimer
The information and publications are not meant to be, and do not constitute, financial, investment, trading, or other types of advice or recommendations supplied or endorsed by TradingView. Read more in the Terms of Use.