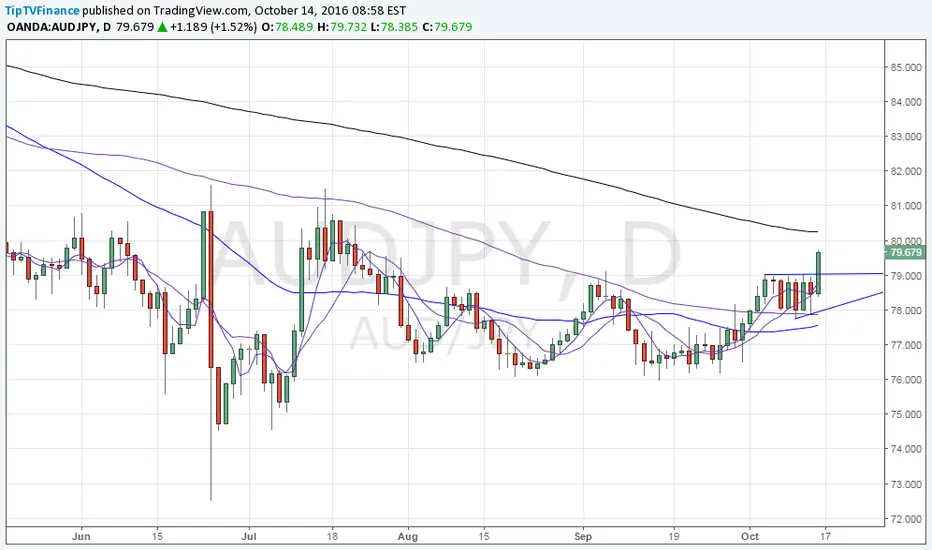
Bullish break from flag pattern (break above 79.00 handle) suggests continuation of the rally from September low of 75.97 and open doors for a test of 200-DMA level of 80.24.
Also note, the 200-DMA is not sloping downwards anymore and thus there is potential for a bullish break above the same.
On the lower side, only a daily close below 78.00 (also 100-DMA) would signal bullish invalidation.
Also note, the 200-DMA is not sloping downwards anymore and thus there is potential for a bullish break above the same.
On the lower side, only a daily close below 78.00 (also 100-DMA) would signal bullish invalidation.
Related publications
Disclaimer
The information and publications are not meant to be, and do not constitute, financial, investment, trading, or other types of advice or recommendations supplied or endorsed by TradingView. Read more in the Terms of Use.
Related publications
Disclaimer
The information and publications are not meant to be, and do not constitute, financial, investment, trading, or other types of advice or recommendations supplied or endorsed by TradingView. Read more in the Terms of Use.