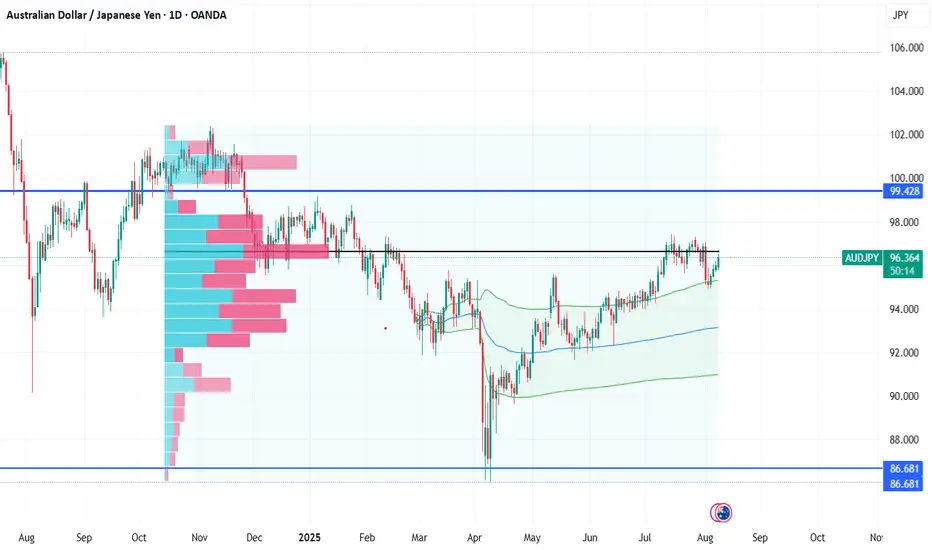
📈 AUD/JPY Daily Chart
🛠 Tools Used:
🔹 Volume Profile (Visible Range) – to spot high-activity price zones.
🔹 Support & Resistance Lines – key zones at 99.428 🛑 and 86.681 🟢.
🔹 50, 100 & 200-Day SMAs – to track trend direction and dynamic support.
📊 Market Snapshot:
AUD/JPY is currently at 96.364, showing steady bullish momentum 📈 after bouncing from the 50-day SMA.
The Volume Profile reveals a large cluster of trading activity between 95.00 – 97.50, making this the current value area.
⚠️ Key Zones to Watch:
Resistance: 97.50 → 99.428 (Major hurdle 🚧)
Support: 94.50 → 92.00 → 86.681 (Long-term floor)
💡 Trade Idea:
✅ Bullish scenario: Break & close above 97.50 could trigger a rally towards 99.40.
❌ Bearish scenario: Drop below 94.50 could invite sellers back to test 92.00 and possibly 86.68.
📌 Summary:
The bulls are in control, but the real test lies ahead at 99.428 – a zone where sellers historically step in. Watch price action closely near resistance for confirmation before entering a breakout trade.
Disclaimer
The information and publications are not meant to be, and do not constitute, financial, investment, trading, or other types of advice or recommendations supplied or endorsed by TradingView. Read more in the Terms of Use.
Disclaimer
The information and publications are not meant to be, and do not constitute, financial, investment, trading, or other types of advice or recommendations supplied or endorsed by TradingView. Read more in the Terms of Use.