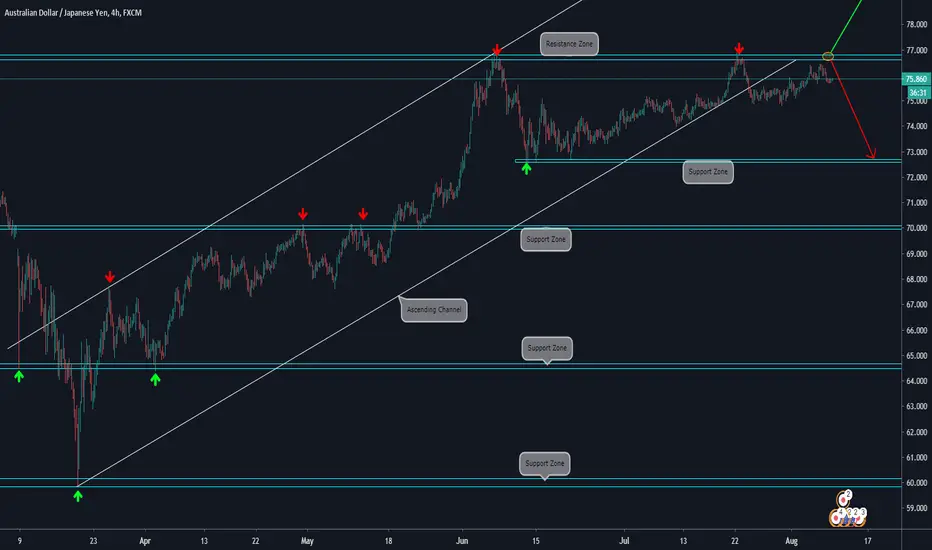
🔸 4H CHART EXPLANATION:
.
.
🔸Price did a double top pattern at the Resistance Zone.
.
🔸It has broken the Ascending Trendline, however, it did not start a bearish move after that.
.
🔸 We are waiting for some bearish momentum before considering a bearish trade.
.
🔸 Will look for a lower timeframe bearish setup.
🔸 DAILY CHART ANALYIS:

.
.
🔸Price did a double top pattern at the Resistance Zone.
.
🔸It has broken the Ascending Trendline, however, it did not start a bearish move after that.
.
🔸 We are waiting for some bearish momentum before considering a bearish trade.
.
🔸 Will look for a lower timeframe bearish setup.
🔸 DAILY CHART ANALYIS:
Disclaimer
The information and publications are not meant to be, and do not constitute, financial, investment, trading, or other types of advice or recommendations supplied or endorsed by TradingView. Read more in the Terms of Use.
Disclaimer
The information and publications are not meant to be, and do not constitute, financial, investment, trading, or other types of advice or recommendations supplied or endorsed by TradingView. Read more in the Terms of Use.