Do you trade AUD pairs? If yes, look for trends to start during the overlapping session with Tokyo: around 6 hr overlap time.
What To Look For:
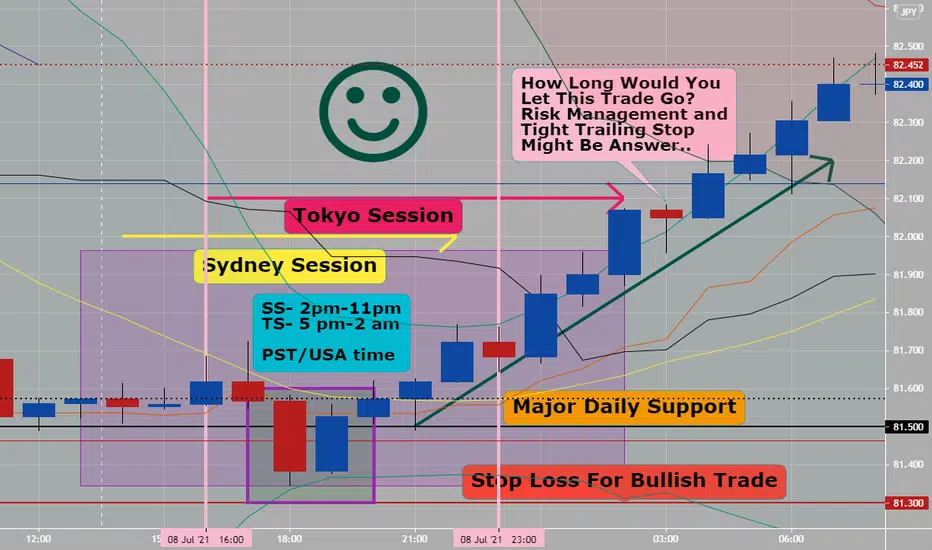
1) Look on hourly charts for trends with AUDxxx or xxxAUD pairs to start during Sydney-Tokyo overlapping session (slow but great risk/reward setups)
2) See AUDJPY 1 hour chart example- excellent Harami two candle pattern to set up a bullish trade with. (placed in purple box on chart)
3) 81.500 price level is a highly psychological price level for big banks and realtor traders ( both, love price numbers ending with 000,250,500 or 750)
4) On chart is three indicators (that I use either alone or together) to get confluence with to enter a new trade: Yes, price action only with naked charts work.
A- Ichimoku Cloud- price action is above gold line or conversion line (so bullish sign)
B- Pivot Points- price action is above weekly pivot point or red line (so bullish sign)
C- Bollinger Band- price action is on or above 20 ema or middle yellow line and BB squeeze is starting (so bullish sign)
Note: With Aud pairs- look for trends to start during the Sydney session and both Sydney-Tokyo overlapping session- this AUDJPY bullish trade on hourly chart on Friday could have let you ride it for most of the daily session. Do not be greedy when scalping or day trading- get your pip piece of pie and close trade.
With all trading price action and risk management are both #1 (set entry, stop and targets for all trades)-
What To Look For:
1) Look on hourly charts for trends with AUDxxx or xxxAUD pairs to start during Sydney-Tokyo overlapping session (slow but great risk/reward setups)
2) See AUDJPY 1 hour chart example- excellent Harami two candle pattern to set up a bullish trade with. (placed in purple box on chart)
3) 81.500 price level is a highly psychological price level for big banks and realtor traders ( both, love price numbers ending with 000,250,500 or 750)
4) On chart is three indicators (that I use either alone or together) to get confluence with to enter a new trade: Yes, price action only with naked charts work.
A- Ichimoku Cloud- price action is above gold line or conversion line (so bullish sign)
B- Pivot Points- price action is above weekly pivot point or red line (so bullish sign)
C- Bollinger Band- price action is on or above 20 ema or middle yellow line and BB squeeze is starting (so bullish sign)
Note: With Aud pairs- look for trends to start during the Sydney session and both Sydney-Tokyo overlapping session- this AUDJPY bullish trade on hourly chart on Friday could have let you ride it for most of the daily session. Do not be greedy when scalping or day trading- get your pip piece of pie and close trade.
With all trading price action and risk management are both #1 (set entry, stop and targets for all trades)-
Disclaimer
The information and publications are not meant to be, and do not constitute, financial, investment, trading, or other types of advice or recommendations supplied or endorsed by TradingView. Read more in the Terms of Use.
Disclaimer
The information and publications are not meant to be, and do not constitute, financial, investment, trading, or other types of advice or recommendations supplied or endorsed by TradingView. Read more in the Terms of Use.