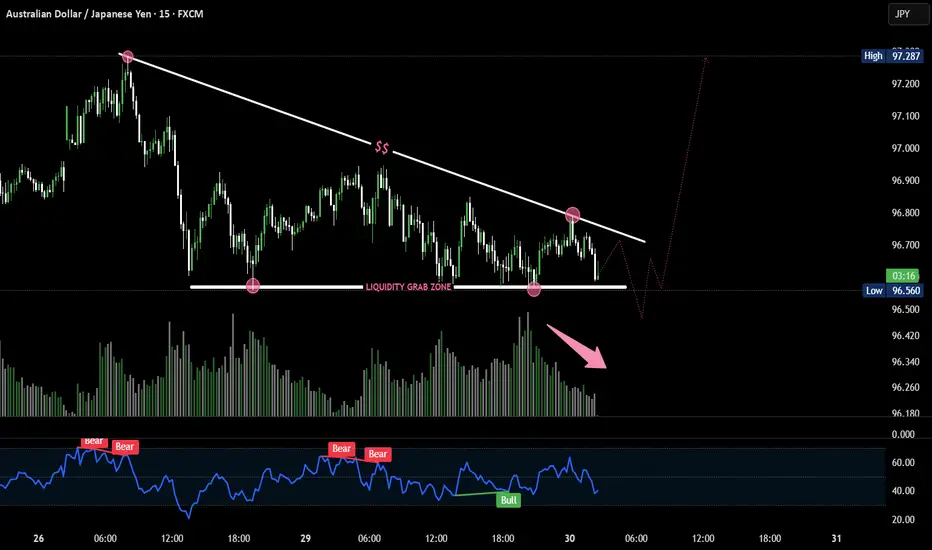
🔍 Key Observations:
🔻 Trendline resistance holding strong, forming lower highs.
📉 Sell-side liquidity resting just below horizontal support (marked zone).
💧 Price dipped into liquidity grab zone twice — sign of stop hunt.
🔁 Classic accumulation schematic forming — repeated sweeps before potential breakout.
📊 Volume divergence: Selling pressure weakening while liquidity is swept.
📉 RSI shows bullish divergence (price making lower lows, RSI making higher lows).
🔁 Rejection at RSI 40-level could indicate a bounce.
📈 Expectation:
One more fake breakdown below 96.500 could trigger aggressive buying — setting up a potential parabolic move toward 97.200+ if breakout occurs.
Disclaimer
The information and publications are not meant to be, and do not constitute, financial, investment, trading, or other types of advice or recommendations supplied or endorsed by TradingView. Read more in the Terms of Use.
Disclaimer
The information and publications are not meant to be, and do not constitute, financial, investment, trading, or other types of advice or recommendations supplied or endorsed by TradingView. Read more in the Terms of Use.