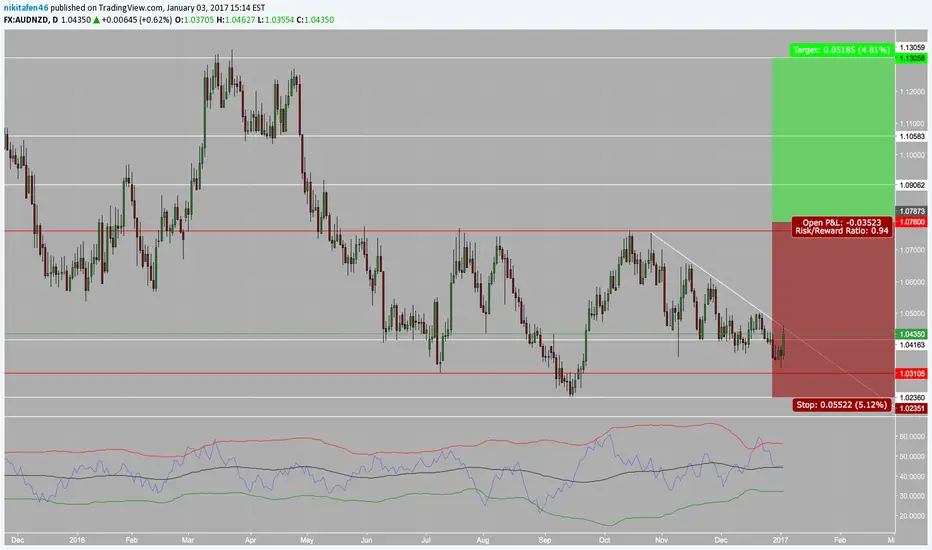
We have a downtrend from the 1.13 area to 1.0236, and within it there is the first shoulder, the head, and the second shoulder, which I believe has already formed. The red resistance at 1.0760 is the resistance neckline, which when broken will initiate a long position up to 1.13, the major zone of previous resistance
On the daily/4h time frame there is a resistance trendline, which when broken will signal that the second shoulder has indeed formed.
Additionally, a long position can be taken after the break of this resistance trendline. Remember to have a daily candle close above this, and watch for a retest to reinforce the long position from this 1.05 area.
Disclaimer
The information and publications are not meant to be, and do not constitute, financial, investment, trading, or other types of advice or recommendations supplied or endorsed by TradingView. Read more in the Terms of Use.
Disclaimer
The information and publications are not meant to be, and do not constitute, financial, investment, trading, or other types of advice or recommendations supplied or endorsed by TradingView. Read more in the Terms of Use.