I think all of the indicators are showing WRONG DATA for this chart now.
here are some reasons why I say it may go down !!!!
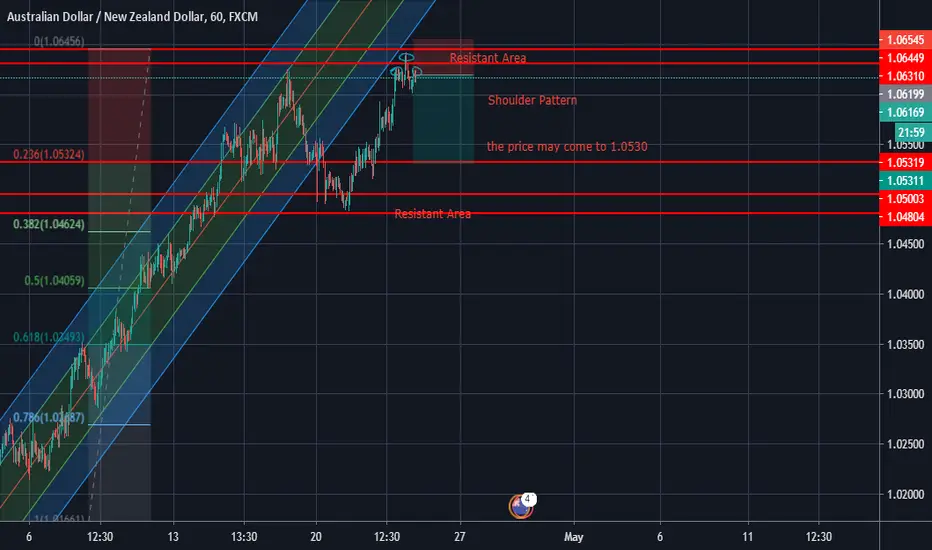
1-as you see, there is a very nice resistance area at top.
2- Double top pattern shows that the price is not strong enough to go high.
3- last high is not higher than previous high
4-its also a shoulder pattern
5-the Fibonacci retracement exactly shows the range
I'm almost sure about falling down.
BUT DON'T RISK MUCH, Its the market !
Have Fun :-)
Mohammad Someaneshin
here are some reasons why I say it may go down !!!!
1-as you see, there is a very nice resistance area at top.
2- Double top pattern shows that the price is not strong enough to go high.
3- last high is not higher than previous high
4-its also a shoulder pattern
5-the Fibonacci retracement exactly shows the range
I'm almost sure about falling down.
BUT DON'T RISK MUCH, Its the market !
Have Fun :-)
Mohammad Someaneshin
Trade active
Disclaimer
The information and publications are not meant to be, and do not constitute, financial, investment, trading, or other types of advice or recommendations supplied or endorsed by TradingView. Read more in the Terms of Use.
Disclaimer
The information and publications are not meant to be, and do not constitute, financial, investment, trading, or other types of advice or recommendations supplied or endorsed by TradingView. Read more in the Terms of Use.