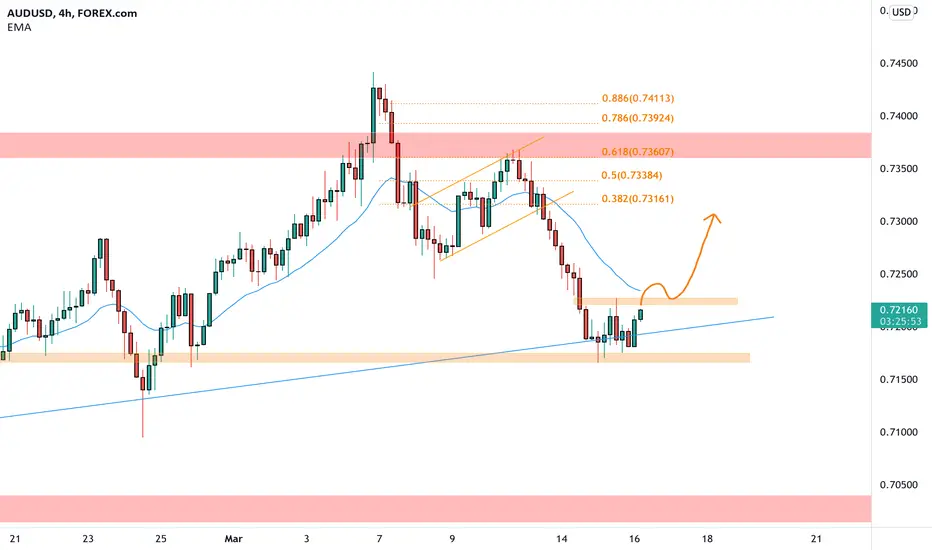
AUDUSD on the 4h chart after the recent start a retracement move until the 0.71700 area.
At the beginning of the downtrend, I can see an attempt of the price to break the resistance level at the 0.73600 over the 0.618 Fibonacci level, with the following bear pressure coming in that pushes lower the price with a consequent break of the bear flag and the daily ascending trendline.
How can we approach this scenario?
Now the market pounced over a minor support and after a large. number of red candle i can expect some retracement to the upside.
We will wait for the European market open and check if the price will break above the support area, in that case, i ll check for a possible long entry according to the Plancton's academy rules.
–––––
Follow the Shrimp
Keep in mind.
🟣 Purple structure -> Monthly structure.
🔴 Red structure -> Weekly structure.
🔵 Blue structure -> Daily structure.
🟡 Yellow structure -> 4h structure.
⚫️ Black structure -> <4h structure.
Here is the Plancton0618 technical analysis , please comment below if you have any question.
The ENTRY in the market will be taken only if the condition of the Plancton0618 strategy will trigger
Note
Note
Note
Note
Note
Note
Everything seems ready for a new recent high, 285 pips since my idea
Note
Note
Note
Note
Note
Note
Note
Disclaimer
The information and publications are not meant to be, and do not constitute, financial, investment, trading, or other types of advice or recommendations supplied or endorsed by TradingView. Read more in the Terms of Use.
Disclaimer
The information and publications are not meant to be, and do not constitute, financial, investment, trading, or other types of advice or recommendations supplied or endorsed by TradingView. Read more in the Terms of Use.