📈 AUD/USD – Daily Time Frame Bullish Outlook
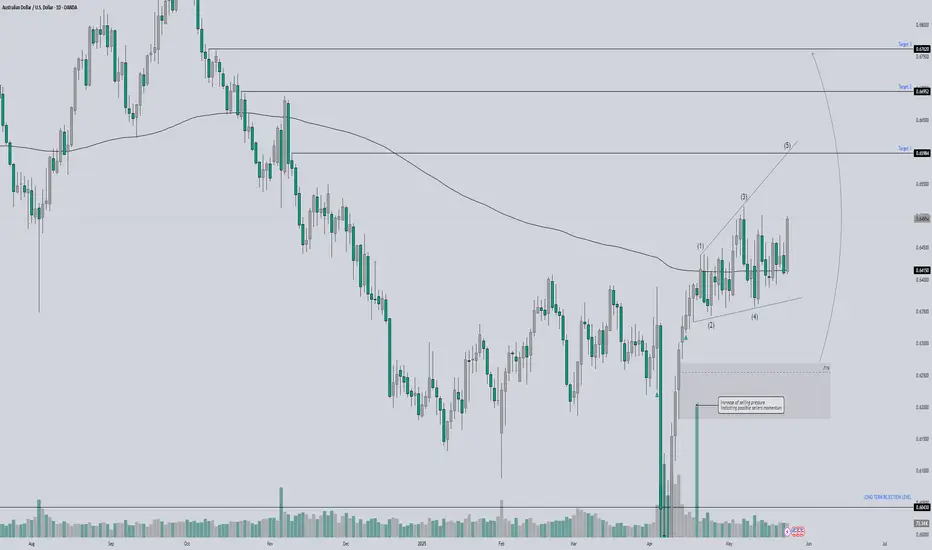
We’re currently in a clear impulsive wave structure with Elliott Wave (1)-(5) unfolding within a rising wedge formation — signaling potential strength but also the need for confirmation at key resistance levels.
🔹 Wave Structure:
Price is completing or near completion of Wave (5), indicating bullish continuation unless structure breaks.
Volume is increasing at the lows, suggesting strong accumulation followed by impulsive pushes upward.
🔹 Fibonacci & Support Zone:
The recent bounce originated from a long-term demand zone aligned with the 71% Fibonacci retracement, confirming strong buyer interest at discounted levels.
🔹 Volume Insight:
Sharp spike in volume during the initial reversal suggests smart money stepping in.
"Increase of selling pressure" was observed in the highlighted zone, but price held firm, hinting at absorption.
🔹 EMA Resistance:
Price is approaching dynamic resistance around the 200 EMA — a key level to watch for short-term pullbacks or breakouts.
🔹 Target Levels:
Target 1: 0.65984
Target 2: 0.66952
Target 3: 0.67200
These levels align with historical price imbalances and potential liquidity zones — offering attractive bullish targets if momentum continues.
Disclaimer
The information and publications are not meant to be, and do not constitute, financial, investment, trading, or other types of advice or recommendations supplied or endorsed by TradingView. Read more in the Terms of Use.
Disclaimer
The information and publications are not meant to be, and do not constitute, financial, investment, trading, or other types of advice or recommendations supplied or endorsed by TradingView. Read more in the Terms of Use.