Identification Guidelines
Points Discussion
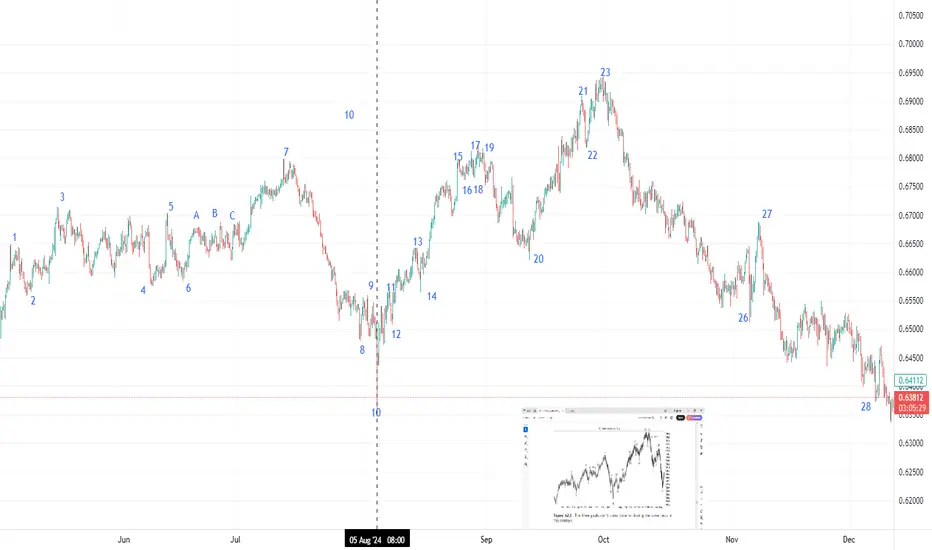
1, 2 This is the base. It may or may not appear and has no significance.
3, 5, 7 These points form the three peaks pattern. It’s not a triple top where price
needs to peak near the same price. The shape of the peaks may be flat or
pointed. The time between peak 3 and 7 is about 8 months.
4, 6, 8 These are valleys between peaks 3, 5, and 7. The drop to the valley floor
can be considerable (that is, the retrace of the move up from 2 to 3 can
be large).
8, 9, 10 This is the separating decline. Price drops in at least two selling waves (7 to 8
and 9 to 10). The word least suggests there can be multiple selling waves,
so be flexible. The separating decline divides the three peaks from the
domed house, making both look squarish.
10 Valley 10 is always lower than 4 or 6 and often lower than both.
11–14 Price bottoms at 10 and then recovers to form at least two valleys that test
the low at 10. The peaks and valleys here should look symmetrical, not
irregular.
14–23 or 27 The time from turn 14 to 23 should be 7 months and 8-to-10 days, but
the measure from 14 can include peak 27. In other words, be flexible
and don’t exclude a pattern because the duration is incorrect. If price
at 12 or 14 fails to test the low at 10 (or 12 or 14 are absent), then
try using valley 4 or 6 in the 7-month calculation to better predict the
domed house peak.
15 Price rises quickly and steeply to peak 15, forming the left wall of the
first story.
15–20 Look for price to form five waves here, 15–16, 16–17, and so on, ending
at 19–20. Price bounces between peaks and valleys, forming the firstfloor
roof.
20–21 This is the second story’s left wall. It’s the move up to 21 from 20.
21–25 This is the dome of the house. Price forms another set of peaks and valleys,
trying to move to a new high but failing.
25–27 Price drops from 25 and forms a wave 26–27, which may mirror the roof
from 15–20. Point 27, if tall enough, may be the right shoulder of a headand-
shoulders top formed by the move from 21–25.
27–28 Price drops all the way back to the level of point 10 (or close to it). The drop
may be a straight-line run down or it may have several retraces, but price
will eventually make it to the price of 10 (in theory).
Thomas_N_Bulkowski_Encyclopedia_of_Chart_Patterns_John_Wiley_&_Sons
Disclaimer
The information and publications are not meant to be, and do not constitute, financial, investment, trading, or other types of advice or recommendations supplied or endorsed by TradingView. Read more in the Terms of Use.
Disclaimer
The information and publications are not meant to be, and do not constitute, financial, investment, trading, or other types of advice or recommendations supplied or endorsed by TradingView. Read more in the Terms of Use.