AUDUSD Diamont Bottom Pattern - expect higher prices post FOMC
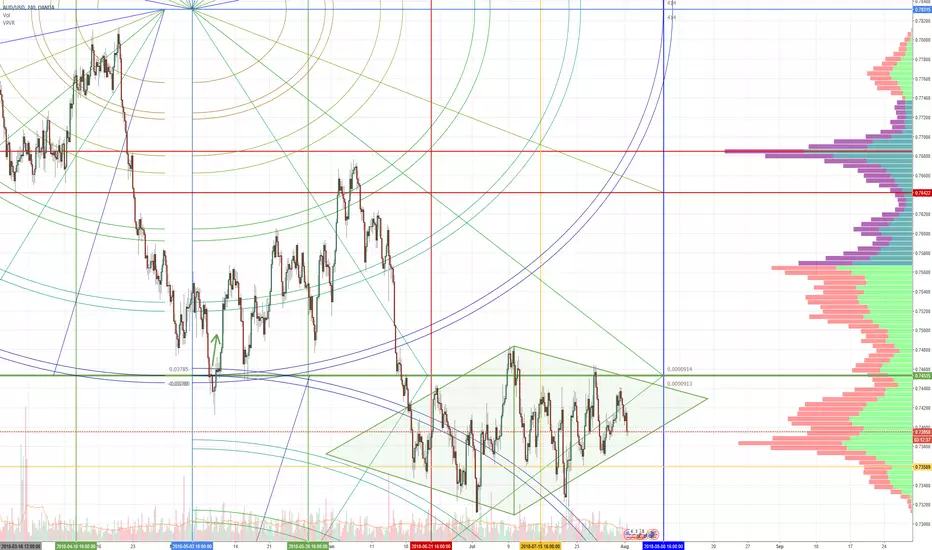
The diamond pattern is a very rare pattern. It is a combination of a broadening pattern and a symmetrical triangle. They are rare, hard to observe and it's easy to miss them. However, Bulkowski's ranking system rated the diamond bottom pattern as the #1 pattern in terms of performance. The AUDUSD chart is showing a diamond bottom right at the end of some significant Gann cycles and the FOMC info. High probability of prices breakout of the diamond and moving higher.
Note
Breakout up ahead. Also:Gann wrote about a few specific dates in his books and one of them was August 8th. He said of August 8th, "47 days from June 22nd, very important for a change in trend and watch for tops or bottoms."
The fact that we have made new lows/highs or have returned to the lows/highs of the year is important, especially because of this date. The time cycle itself is enough of a reason for a reversal.
And this is not reserved just for ADA , it applies to the entire cryptocurrency market.
It applies to Forex as well, specifically pairs like AUDUSD 0.23% , NZDUSD 0.33% , GBPUSD -0.39% , and USDJPY -0.35% . - the DXY -0.13% in general.
It also applies to the US equity markets.
Disclaimer
The information and publications are not meant to be, and do not constitute, financial, investment, trading, or other types of advice or recommendations supplied or endorsed by TradingView. Read more in the Terms of Use.
Disclaimer
The information and publications are not meant to be, and do not constitute, financial, investment, trading, or other types of advice or recommendations supplied or endorsed by TradingView. Read more in the Terms of Use.