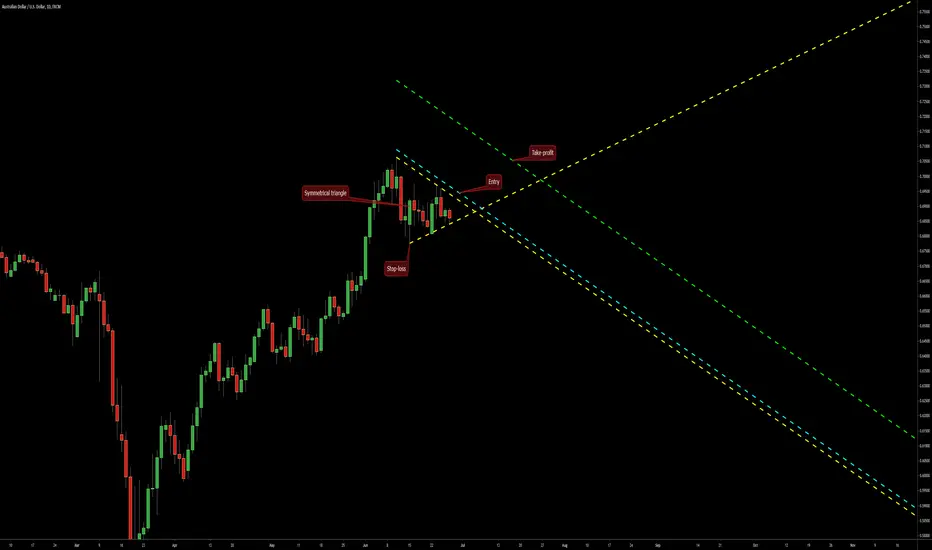
This symmetrical triangle pattern presents an opportunity for a potential bullish breakout trade on AUD/USD on the daily timeframe. The triangle's borders are marked with the yellow lines. My potential entry level is shown with the cyan line. My potential take-profit level is where the green line is. I will set my stop-loss to the low of the triangle's base - at 0.67757.
Trade active
Entry hit @ 0.69358 at 14:00 UTC yesterday. SL=0.67757, TP=0.71586.Trade closed: target reached
TP of 0.70309 hit today at 0:32 UTC.You can find useful tools to detect, build, and trade chart patterns - all completely free on earnforex.com.
Disclaimer
The information and publications are not meant to be, and do not constitute, financial, investment, trading, or other types of advice or recommendations supplied or endorsed by TradingView. Read more in the Terms of Use.
You can find useful tools to detect, build, and trade chart patterns - all completely free on earnforex.com.
Disclaimer
The information and publications are not meant to be, and do not constitute, financial, investment, trading, or other types of advice or recommendations supplied or endorsed by TradingView. Read more in the Terms of Use.