Daily chart: head and shoulders resolved to upside after it broke neckline at 0.91000. We had follow through to 0.94610 then entered into complex pullback (bull flag) which was broken up with potent, igniting candle and now it is building nice upper level base above all key moving averages.
Shorter-term tech analysis:
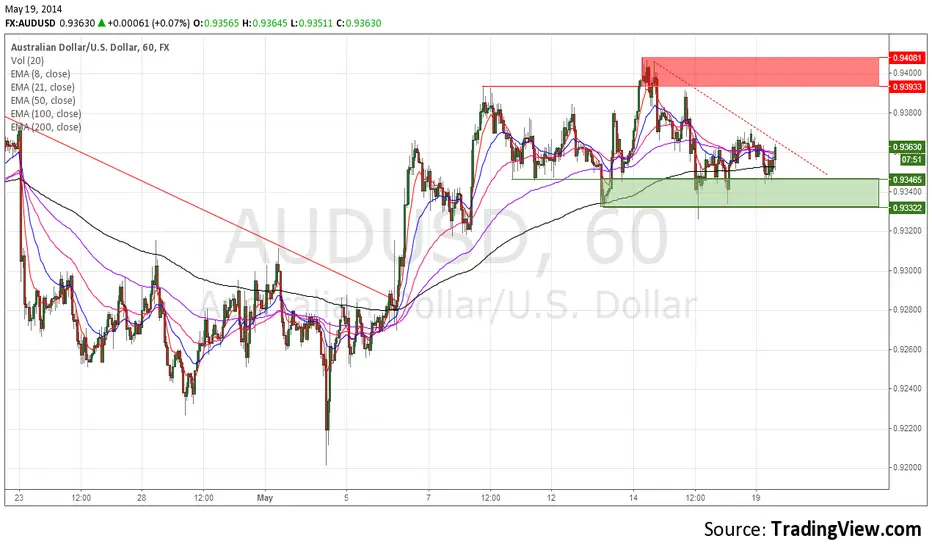
Pair entered into rnage bound market sith support zone from 0.93322 to 0.93465 and resistance zone 0.93933-0.94081
Trading plan:
entry close to support zone then on break up of trend line inside of that range and then on break up of resistance.
Shorter-term tech analysis:
Pair entered into rnage bound market sith support zone from 0.93322 to 0.93465 and resistance zone 0.93933-0.94081
Trading plan:
entry close to support zone then on break up of trend line inside of that range and then on break up of resistance.
Related publications
Disclaimer
The information and publications are not meant to be, and do not constitute, financial, investment, trading, or other types of advice or recommendations supplied or endorsed by TradingView. Read more in the Terms of Use.
Related publications
Disclaimer
The information and publications are not meant to be, and do not constitute, financial, investment, trading, or other types of advice or recommendations supplied or endorsed by TradingView. Read more in the Terms of Use.