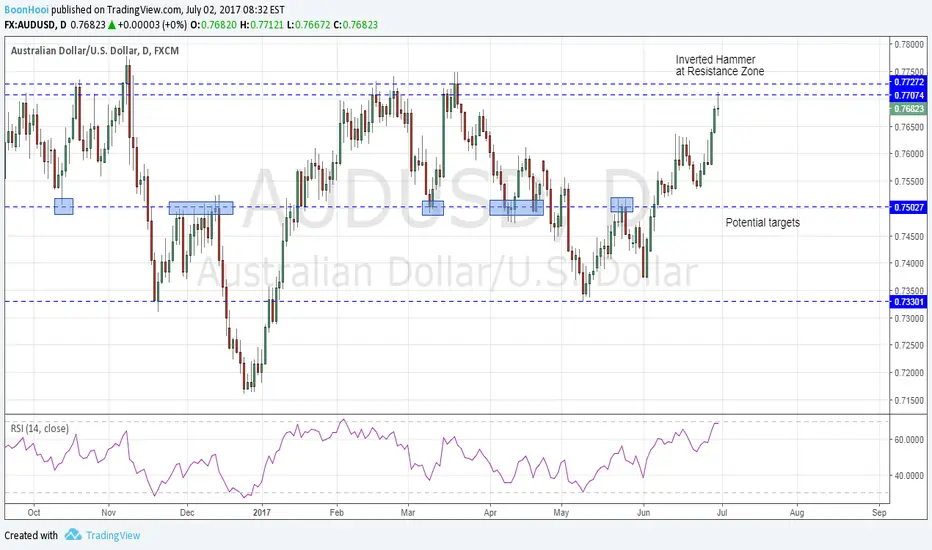
What the chart is showing us:
- AUDUSD approaching resistance at the 0.7700/50 levels
- Friday candle closed and formed an inverted hammer
- RSI just about touching the OB levels
- Completed a Harmonic bearish Bat pattern
Potential targets down at 0.7500 (support/resistance zone)
Let's see how the price moves at the start of the week
Trade active
Current moment the Daily chart looks like an Evening Star.Triggered a sell as the price went below the low of the Star at 0.7669
Trade closed manually
Woke up this morning and saw that price was not going anywhere since last night.Closed off the trade with +52pips.
I am ready to re-establish the short if AUDUSD makes a new low. Will monitor and post as new idea if this happens
Disclaimer
The information and publications are not meant to be, and do not constitute, financial, investment, trading, or other types of advice or recommendations supplied or endorsed by TradingView. Read more in the Terms of Use.
Disclaimer
The information and publications are not meant to be, and do not constitute, financial, investment, trading, or other types of advice or recommendations supplied or endorsed by TradingView. Read more in the Terms of Use.
