AUD/USD Technical Analysis – H1 Chart
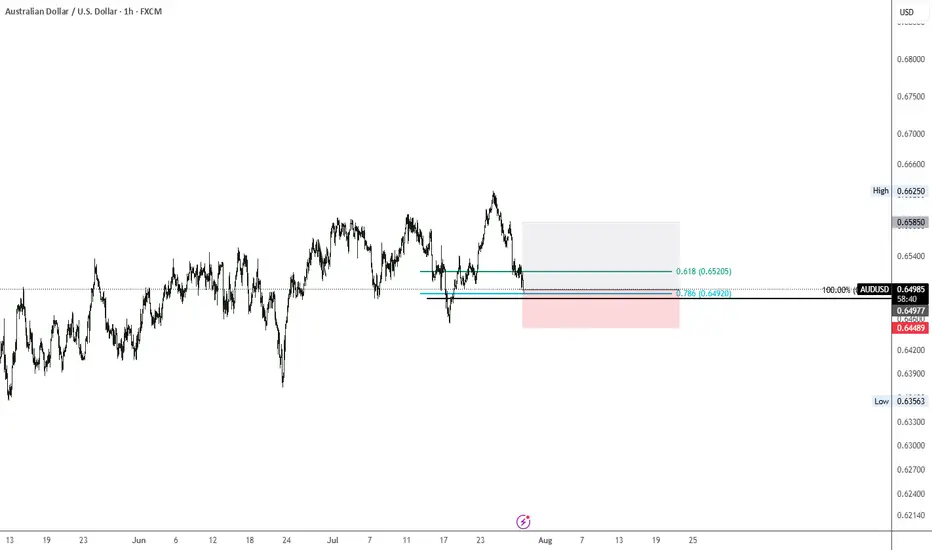
The AUD/USD pair is currently testing a key demand zone around the 0.6490 level, aligning closely with the 78.6% Fibonacci retracement from the recent bullish swing. Price is reacting to this support after breaking below the 0.6520–0.6530 area, which previously acted as structure support and now flips to resistance.
This zone between 0.6490 and 0.6520 will be critical:
A bullish reaction here could push price back towards the 0.6585 resistance and potentially the 0.6625 swing high.
A break below the 0.6490–0.6480 support zone, especially on a high-volume candle, would open the door for further downside toward 0.6440 and possibly the 0.6365 low.
Trade Setup Idea:
Entry: Around 0.6490 (confirmation-based)
SL: Below 0.6440
TP1: 0.6520
TP2: 0.6585
The confluence of Fib levels and price structure makes this a zone of high interest for intraday and swing traders. Monitor closely for bullish candlestick confirmations before entering long positions.
Disclaimer
The information and publications are not meant to be, and do not constitute, financial, investment, trading, or other types of advice or recommendations supplied or endorsed by TradingView. Read more in the Terms of Use.
Disclaimer
The information and publications are not meant to be, and do not constitute, financial, investment, trading, or other types of advice or recommendations supplied or endorsed by TradingView. Read more in the Terms of Use.