30 Mins Frame
🧠 Technical Overview:
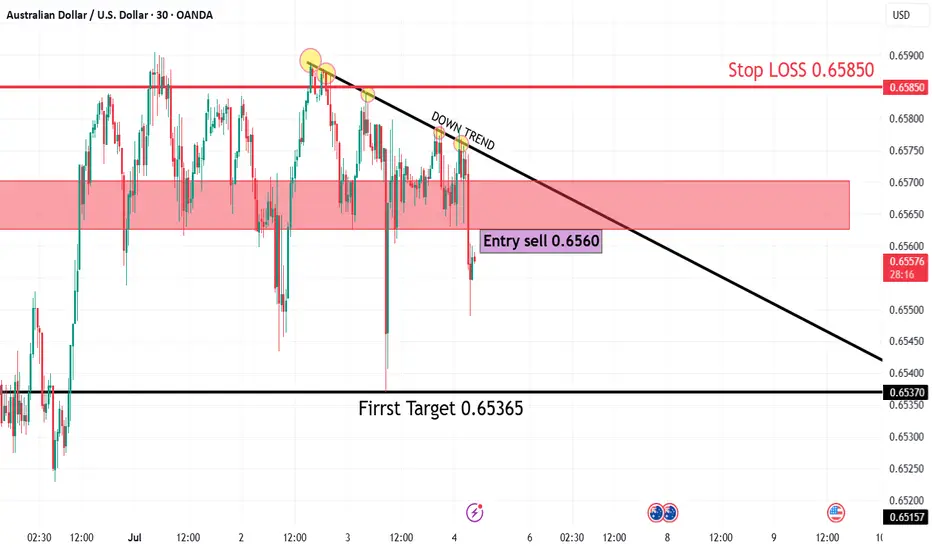
The pair is moving in a clear downtrend, as confirmed by the descending trendline connecting multiple lower highs.
Every bullish attempt has been rejected at this trendline, showing strong seller pressure.
🧩 Key Technical Elements:
1. Downtrend Line:
Accurately drawn across descending highs.
Price has tested and rejected from this line multiple times, confirming its strength as a dynamic resistance.
2. Supply Zone:
Highlighted in red between 0.6565 and 0.6575.
Price entered this zone and was immediately rejected, reinforcing bearish sentiment.
3. Entry Point:
Sell at 0.6560, after price failed to break above both the supply zone and trendline resistance.
4. Stop Loss:
0.65850, placed just above the supply zone and the previous high — a safe level to exit if the setup fails.
5. Target Levels:
First Target: 0.65365 – a minor support level and reasonable short-term target.
Major Target: 0.65157 – a stronger previous support and potential reversal point.
📉 Expected Price Action:
As long as the price stays below the trendline and supply zone, further downside is expected.
The most recent price action shows a false breakout above resistance followed by a sharp drop, typical behavior in a downtrend.
🔥 Risk-to-Reward Ratio (R:R):
First Target:
Risk: 0.65850 – 0.6560 = 25 pips
Reward: 0.6560 – 0.65365 = 23.5 pips
→ R:R ≈ 1:1
Major Target:
Reward: 0.6560 – 0.65157 = 44.3 pips
→ R:R ≈ 1.8:1
✅ Solid R:R ratio especially toward the major target.
✅ Conclusion:
This is a technically sound short setup in line with the dominant downtrend.
The rejection from both the supply zone and trendline strengthens the bearish case.
Suitable for short- to medium-term traders, with clearly defined risk management.
🧠 Technical Overview:
The pair is moving in a clear downtrend, as confirmed by the descending trendline connecting multiple lower highs.
Every bullish attempt has been rejected at this trendline, showing strong seller pressure.
🧩 Key Technical Elements:
1. Downtrend Line:
Accurately drawn across descending highs.
Price has tested and rejected from this line multiple times, confirming its strength as a dynamic resistance.
2. Supply Zone:
Highlighted in red between 0.6565 and 0.6575.
Price entered this zone and was immediately rejected, reinforcing bearish sentiment.
3. Entry Point:
Sell at 0.6560, after price failed to break above both the supply zone and trendline resistance.
4. Stop Loss:
0.65850, placed just above the supply zone and the previous high — a safe level to exit if the setup fails.
5. Target Levels:
First Target: 0.65365 – a minor support level and reasonable short-term target.
Major Target: 0.65157 – a stronger previous support and potential reversal point.
📉 Expected Price Action:
As long as the price stays below the trendline and supply zone, further downside is expected.
The most recent price action shows a false breakout above resistance followed by a sharp drop, typical behavior in a downtrend.
🔥 Risk-to-Reward Ratio (R:R):
First Target:
Risk: 0.65850 – 0.6560 = 25 pips
Reward: 0.6560 – 0.65365 = 23.5 pips
→ R:R ≈ 1:1
Major Target:
Reward: 0.6560 – 0.65157 = 44.3 pips
→ R:R ≈ 1.8:1
✅ Solid R:R ratio especially toward the major target.
✅ Conclusion:
This is a technically sound short setup in line with the dominant downtrend.
The rejection from both the supply zone and trendline strengthens the bearish case.
Suitable for short- to medium-term traders, with clearly defined risk management.
Disclaimer
The information and publications are not meant to be, and do not constitute, financial, investment, trading, or other types of advice or recommendations supplied or endorsed by TradingView. Read more in the Terms of Use.
Disclaimer
The information and publications are not meant to be, and do not constitute, financial, investment, trading, or other types of advice or recommendations supplied or endorsed by TradingView. Read more in the Terms of Use.