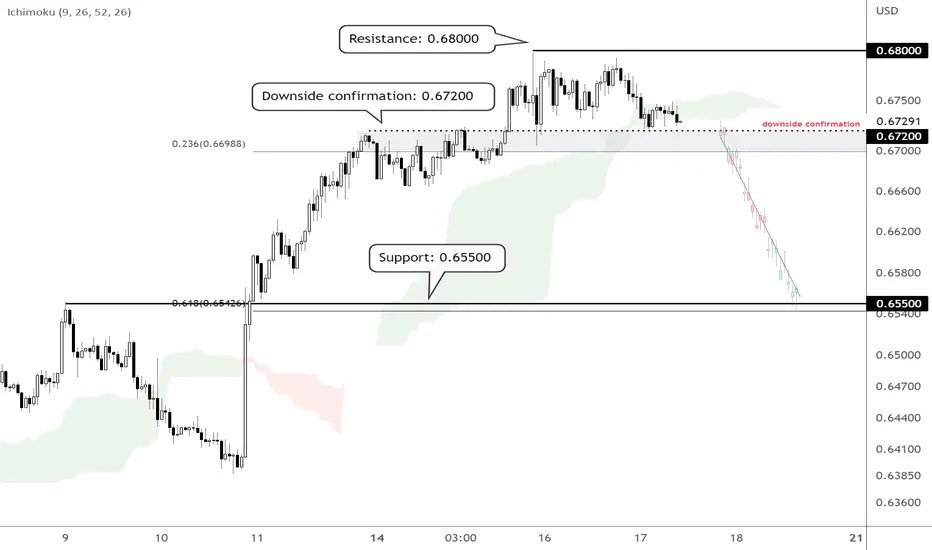
On the H1 time frame, prices are testing the support zone at 0.67200, in line with the 23.6% Fibonacci retracement where a break below this zone could provide the bearish acceleration with further downside seen to the next support target at 0.65500. This 0.6550 support zone lines up with the 61.8% Fibonacci retracement. Failure to break below the 0.67200 support zone could see prices push higher to test the resistance at 0.68000. Prices are holding below the Ichimoku cloud as well, supporting the bearish bias.
Disclaimer
The information and publications are not meant to be, and do not constitute, financial, investment, trading, or other types of advice or recommendations supplied or endorsed by TradingView. Read more in the Terms of Use.
Disclaimer
The information and publications are not meant to be, and do not constitute, financial, investment, trading, or other types of advice or recommendations supplied or endorsed by TradingView. Read more in the Terms of Use.