Hey guys,
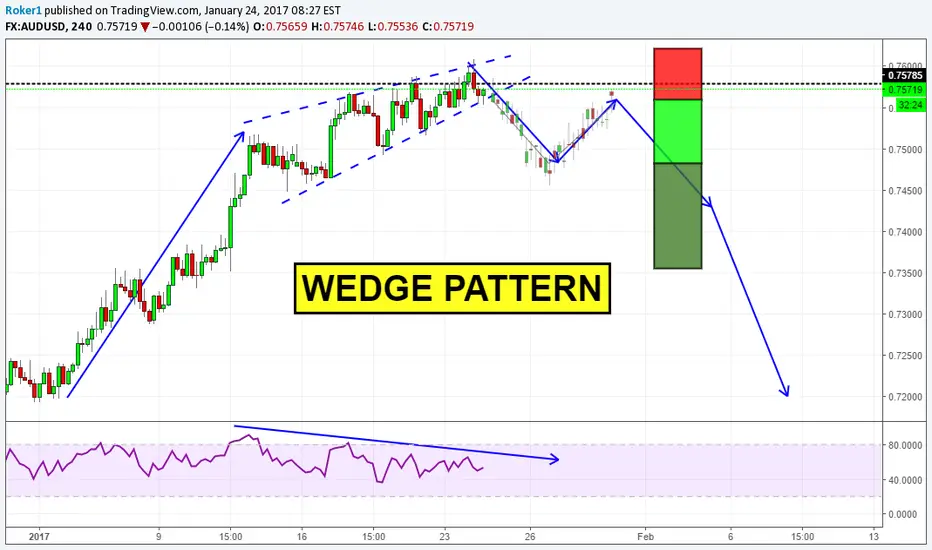
today i want to share with you another opportunity on AUDUSD. For those who are not familiar with simple patterns, this is a wedge pattern (rising). This kind of formation usually occurs after a very steep movement; you can identify this by drawing two trendlines on the chart. You see the bottom one is steeper than the upper. This means price is going up but with less strenght than before. This is also confirmed by RSI divergence (bottom of the chart) that certifies that bulls' fuel is running out. For those reasons i'm going to watch carefully to this setup waiting for price to break to the downside and then selling the first retracement.
In this particular setup we have plenty of room to the south, thus the risk to reward ratio would be very nice (target2 may be all the way down to 0,720)
Let's see if it comes true.
If you have any question, feel free to write it below.
Otherwise, see you in the next chart!
Note
Now that the wedge's been broken, let's wait and see if price pulls back a bitNote
Entry order 0,7572Trade active
Note
Stop 0,7618sTarget1 0,7526s
Target2 to be determined
Trade closed: target reached
First target hit! Stop at break even and let's ride this till we canTrade closed: target reached
Stopped out at break evenDisclaimer
The information and publications are not meant to be, and do not constitute, financial, investment, trading, or other types of advice or recommendations supplied or endorsed by TradingView. Read more in the Terms of Use.
Disclaimer
The information and publications are not meant to be, and do not constitute, financial, investment, trading, or other types of advice or recommendations supplied or endorsed by TradingView. Read more in the Terms of Use.