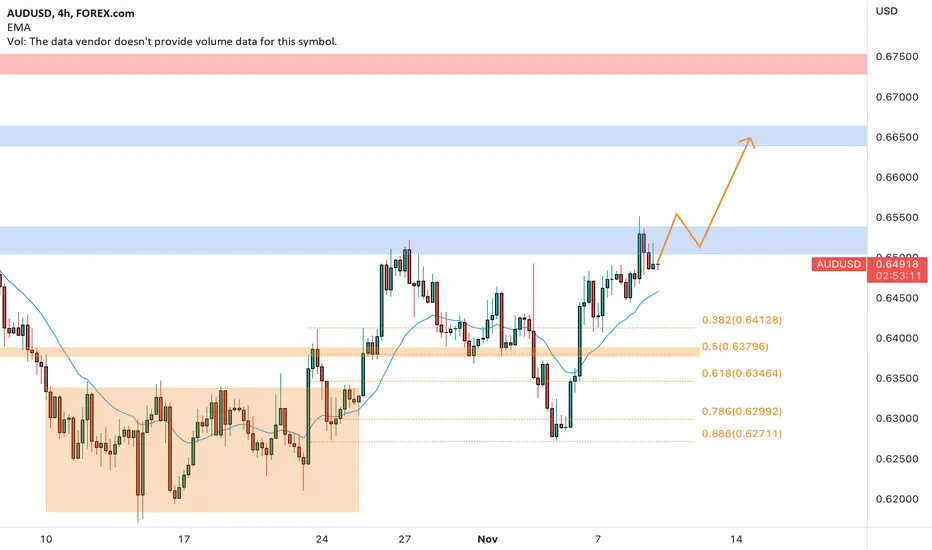
AUDUSD on the 4h chart after the accumulation phase at the recent low started an impulse to the upside.
The market after the first move retraced to the 0.886 Fibonacci level and is now looking for a further bullish continuation.
How can I approach this scenario?
According to Plancton's strategy IF the price will break above the resistance area i will consider a nice long order.
–––––
Follow the Shrimp
Keep in mind.
🟣 Purple structure -> Monthly structure.
🔴 Red structure -> Weekly structure.
🔵 Blue structure -> Daily structure.
🟡 Yellow structure -> 4h structure.
⚫️ Black structure -> <4h structure.
Here is the Plancton0618 technical analysis , please comment below if you have any question.
The ENTRY in the market will be taken only if the condition of the Plancton0618 strategy will trigger
Note
Note
Note
Note
Note
Note
Note
Note
Note
Note
Disclaimer
The information and publications are not meant to be, and do not constitute, financial, investment, trading, or other types of advice or recommendations supplied or endorsed by TradingView. Read more in the Terms of Use.
Disclaimer
The information and publications are not meant to be, and do not constitute, financial, investment, trading, or other types of advice or recommendations supplied or endorsed by TradingView. Read more in the Terms of Use.