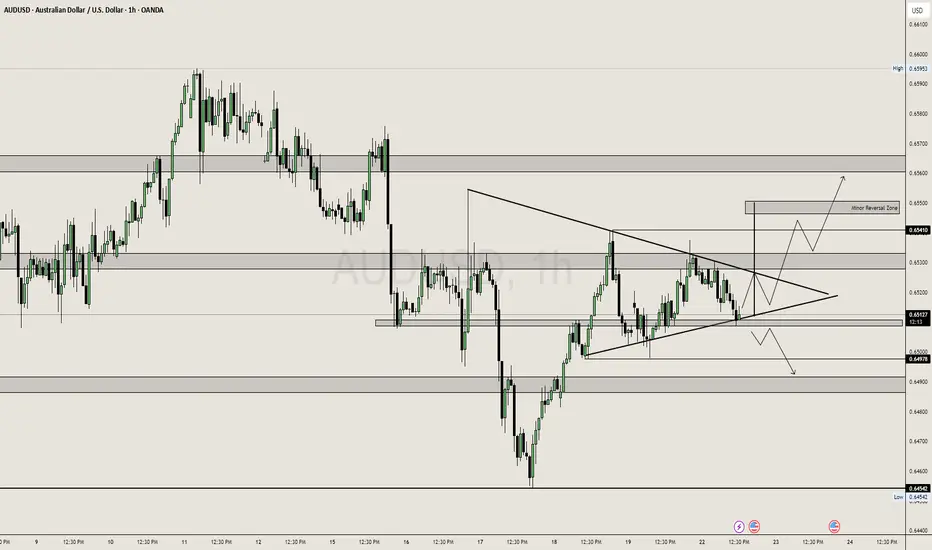
- Price is consolidating inside a symmetrical triangle, showing indecision between bulls and bears.
- Before entering the triangle, the market showed strong bullish momentum, indicating a possible continuation pattern.
- Price is hovering near a key support level (0.6513) where multiple candle wicks suggest buying pressure is defending.
🔍 Key Zones & Levels:
Support (0.6500–0.6510):
Price is reacting strongly here.
A break below this = bearish pressure → could retest lower demand zones.
Resistance (0.6530–0.6541):
Mid-structure resistance.
Clean breakout above this confirms bullish control.
Minor Reversal Zone (0.6555):
If bulls break above triangle, this area may stall price or reverse short term.
Ideal area for TP or trailing SL.
Demand Zone (0.6454):
Strong historical buy zone.
Only likely to hit if triangle breaks down aggressively.
📈 Bullish Scenario:
If price breaks and closes above triangle + 0.6530 zone, expect:
Rally to 0.6541 (first target)
Extension toward 0.6555 where reversal/supply could kick in.
Momentum and volume confirmation needed — no breakout = no trade.
📉 Bearish Scenario:
If price breaks below triangle & 0.6500, expect:
Drop to 0.6490 (minor support)
Further slide toward 0.6454 (major support) if downside accelerates.
Trade closed: target reached
The AU moved in our direction as mentioned.Disclaimer
The information and publications are not meant to be, and do not constitute, financial, investment, trading, or other types of advice or recommendations supplied or endorsed by TradingView. Read more in the Terms of Use.
Disclaimer
The information and publications are not meant to be, and do not constitute, financial, investment, trading, or other types of advice or recommendations supplied or endorsed by TradingView. Read more in the Terms of Use.