AUDUSD Q3 W36 Y25 ForecastHigher Time Frame Overview (Weekly/Da
🔎 AUDUSD Q3 W36 Y25 Forecast
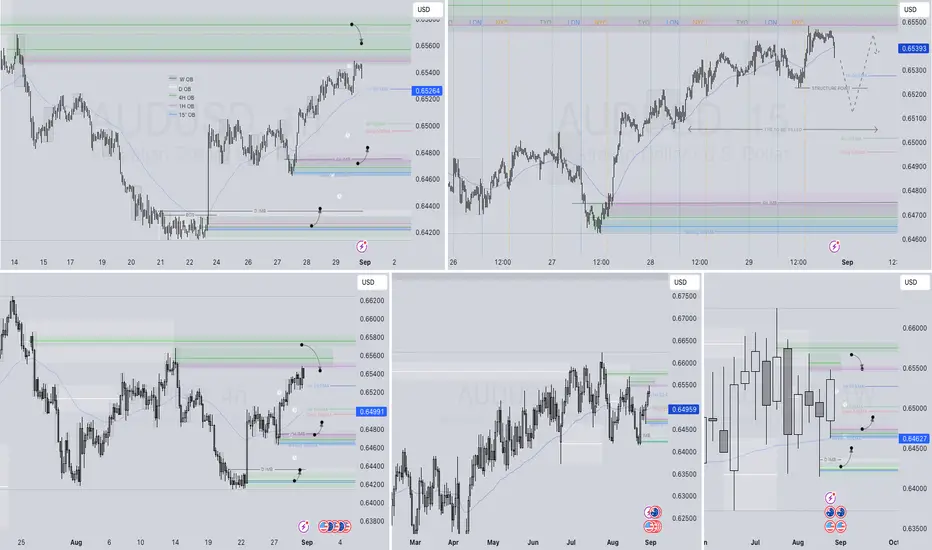
🧠 Higher Time Frame Overview (Weekly/Daily)
There hasn’t been much aggressive movement on the higher timeframes, particularly the weekly and daily charts. That said:
The 50 EMA is sitting comfortably in the middle of price action for August, suggesting consolidation or a clear range-bound market.
This kind of environment offers defined trading ranges, making lower timeframe setups more actionable for both swing and intraday traders.
✅ Plan of Action
🔹 Bullish Bias on Higher Time Frames
Week 35 closed with strong bullish price action, pushing the daily candle above the 50EMA.
This provides confirmation for a higher-probability long setup from range lows.
The weekly candle also supports bullish continuation, forming a solid base and momentum structure.
🔔 Bias: Bullish on higher time frames — prefer buying from support levels or imbalance zones.
🔍 Lower Time Frame Strategy (4H / 15M)
🔸 4H Analysis
A clear 4H order block led to the creation of a lower low, identifying a potential point of interest (POI) for a pullback and intraday short.
Target for the short idea includes:
Weekly imbalance zone
Daily 50EMA
Weekly 50EMA
⚠️ Short positions should be considered countertrend, so:
Stop-losses should be moved to breakeven quickly once structural levels are broken.
Use tight risk management and watch for early signs of rejection from key zones.
🔸 15-Minute Confirmation
Looking for a break of structure (BOS) on the 15M chart to confirm bearish intent.
After BOS, wait for a pullback into a 15M POI before entering a continuation short.
FRGNT
https://tradingview.sweetlogin.com/x/UzKw2M7L/


 AUDUSD
🧠 Higher Time Frame Overview (Weekly/Daily)
There hasn’t been much aggressive movement on the higher timeframes, particularly the weekly and daily charts. That said:
The 50 EMA is sitting comfortably in the middle of price action for August, suggesting consolidation or a clear range-bound market.
This kind of environment offers defined trading ranges, making lower timeframe setups more actionable for both swing and intraday traders.
✅ Plan of Action
🔹 Bullish Bias on Higher Time Frames
Week 35 closed with strong bullish price action, pushing the daily candle above the 50EMA.
This provides confirmation for a higher-probability long setup from range lows.
The weekly candle also supports bullish continuation, forming a solid base and momentum structure.
🔔 Bias: Bullish on higher time frames — prefer buying from support levels or imbalance zones.
🔍 Lower Time Frame Strategy (4H / 15M)
🔸 4H Analysis
A clear 4H order block led to the creation of a lower low, identifying a potential point of interest (POI) for a pullback and intraday short.
Target for the short idea includes:
Weekly imbalance zone
Daily 50EMA
Weekly 50EMA
⚠️ Short positions should be considered countertrend, so:
Stop-losses should be moved to breakeven quickly once structural levels are broken.
Use tight risk management and watch for early signs of rejection from key zones.
🔸 15-Minute Confirmation
Looking for a break of structure (BOS) on the 15M chart to confirm bearish intent.
After BOS, wait for a pullback into a 15M POI before entering a continuation short.
FRGNT
https://tradingview.sweetlogin.com/x/UzKw2M7L/
Related publications
Disclaimer
The information and publications are not meant to be, and do not constitute, financial, investment, trading, or other types of advice or recommendations supplied or endorsed by TradingView. Read more in the Terms of Use.
Related publications
Disclaimer
The information and publications are not meant to be, and do not constitute, financial, investment, trading, or other types of advice or recommendations supplied or endorsed by TradingView. Read more in the Terms of Use.