Hi guys,
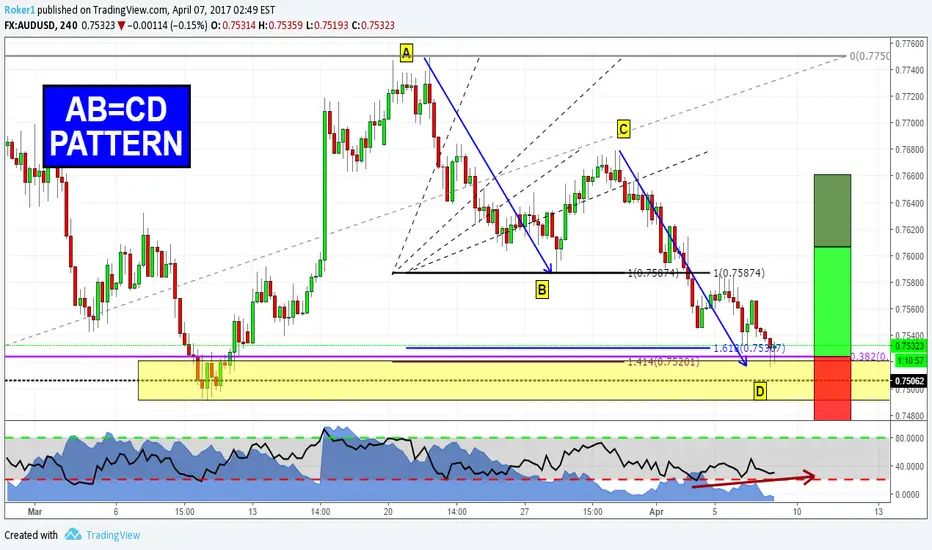
this is the AUDUSD 4hr chart and i've been waiting for this AB=CD to complete for a long time, now the moment has come. We have an AB=CD pattern completing right at a previous daily structure level, with some Fibonacci confluence and a nice RSI divergence.
If price shows us some buy signal it would be a good chance to go long and make some profit, risk to reward ratio seems pretty good.
Keep you updated.
If you want to share your idea about this or simply ask questions, feel free to comment below.
Otherwise, see you in the next chart!
Note
At the moment i'm waiting to see a break of this trendline:Note
Price has now entered the yellow box.Order cancelled
Price broke to the downside, not interested anymore.Disclaimer
The information and publications are not meant to be, and do not constitute, financial, investment, trading, or other types of advice or recommendations supplied or endorsed by TradingView. Read more in the Terms of Use.
Disclaimer
The information and publications are not meant to be, and do not constitute, financial, investment, trading, or other types of advice or recommendations supplied or endorsed by TradingView. Read more in the Terms of Use.