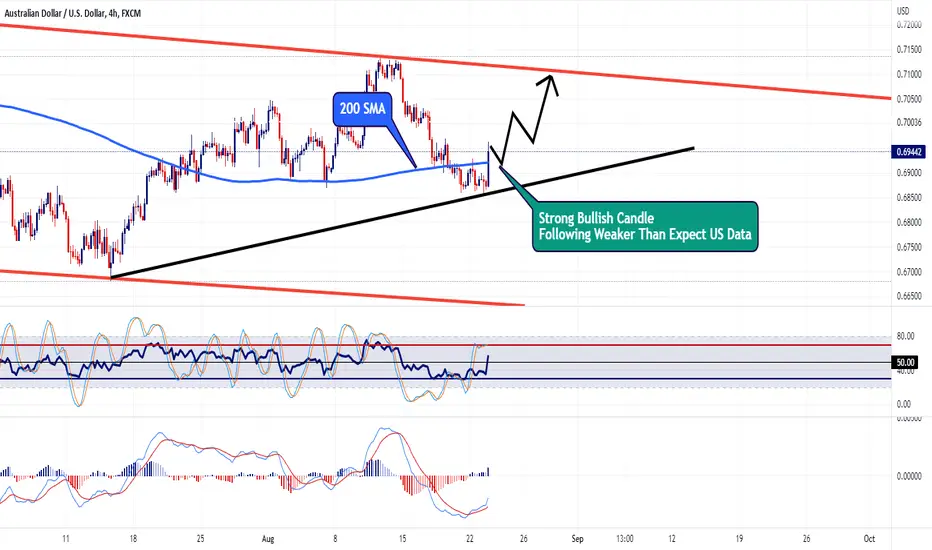
Starting with the 4hr chart above, we can see this pair made a strong push to the upside following this morning's US economic releases.
Manufacturing PMI - weaker than expected
Services PMI - weaker than expected
New Home Sales - - weaker than expected
Let's now take a look at the daily chart
== DAILY ==
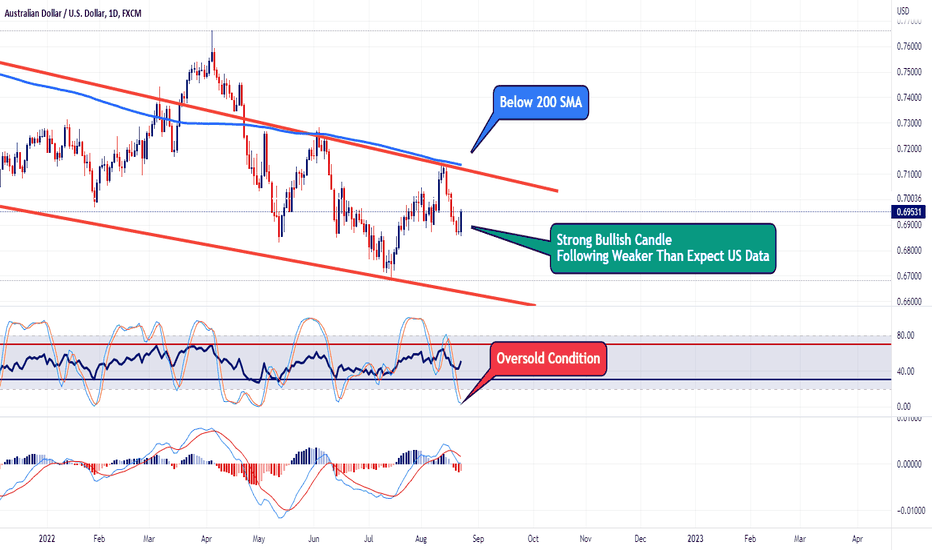
With the daily timeframe we can see Stochastics in indicating a buy signal as the moving averages cross over in the oversold territory. MACD is also indicating less bearish momentum as the histogram turns pink from red. However for the bulls, the upside might be limited to the 200 SMA which nicely correlates with the descending level of resistance in the bearish channel.
Lastly, let's take a look the weekly view.
== WEEKLY ==
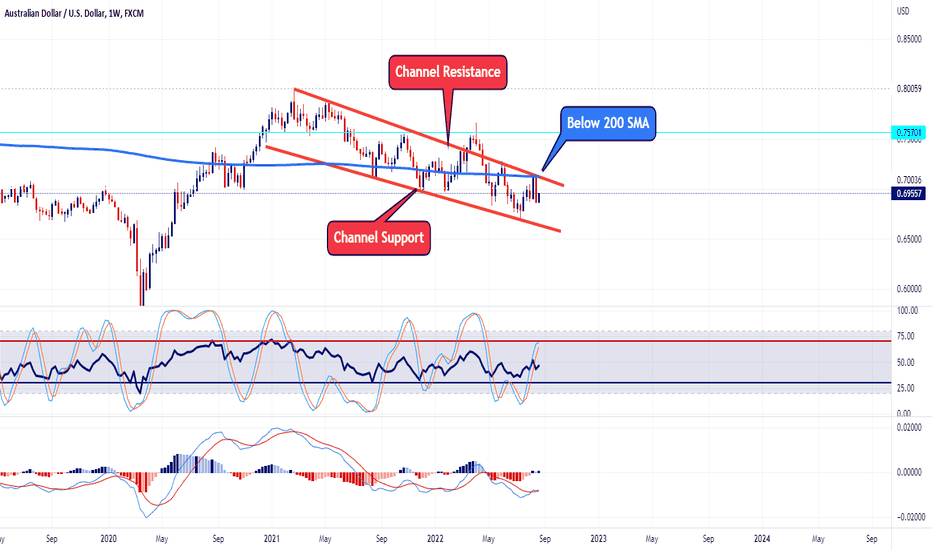
The weekly chart still shows this pair potentially wants to continue it's bear trend. However, as noted above, if we manage to break above the 200 SMA, expect this channel to break and cause a potential bullish rally to the upside.
That's it, that's all. Trade Safe
Manufacturing PMI - weaker than expected
Services PMI - weaker than expected
New Home Sales - - weaker than expected
Let's now take a look at the daily chart
== DAILY ==
With the daily timeframe we can see Stochastics in indicating a buy signal as the moving averages cross over in the oversold territory. MACD is also indicating less bearish momentum as the histogram turns pink from red. However for the bulls, the upside might be limited to the 200 SMA which nicely correlates with the descending level of resistance in the bearish channel.
Lastly, let's take a look the weekly view.
== WEEKLY ==
The weekly chart still shows this pair potentially wants to continue it's bear trend. However, as noted above, if we manage to break above the 200 SMA, expect this channel to break and cause a potential bullish rally to the upside.
That's it, that's all. Trade Safe
Related publications
Disclaimer
The information and publications are not meant to be, and do not constitute, financial, investment, trading, or other types of advice or recommendations supplied or endorsed by TradingView. Read more in the Terms of Use.
Related publications
Disclaimer
The information and publications are not meant to be, and do not constitute, financial, investment, trading, or other types of advice or recommendations supplied or endorsed by TradingView. Read more in the Terms of Use.