SMC Trading point update
Technical analysis of AUD/USD (Australian Dollar / U.S. Dollar) on the 4-hour timeframe, with a likely setup for further downside. Here's a breakdown of the idea:
---
Technical Summary
Pair: AUD/USD
Timeframe: 4H
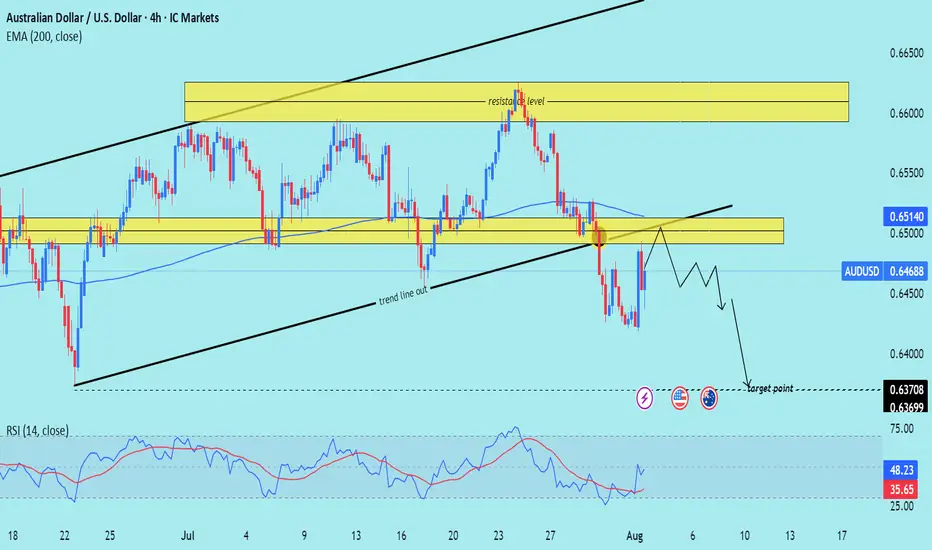
Current Price: 0.64688
EMA 200: 0.65140 (price is below = bearish bias)
RSI (14): 48.23 (neutral to slightly bearish)
--
Key Observations
1. Break of Trendline:
The previous ascending trendline (black) was broken to the downside.
This indicates a shift in market structure from bullish to bearish.
2. Resistance Rejection Zone:
Price recently retested a strong supply/resistance zone (yellow box near 0.65140) and was rejected.
This aligns with the 200 EMA → strong confluence for a sell setup.
3. Market Structure:
Price is forming lower highs, indicating sellers are gaining control.
The chart shows a projection of a bearish continuation pattern (zig-zag decline).
4. Target Zone:
Final target marked near 0.63700–0.63699, a previous support level.
This gives the setup a decent risk-reward ratio if the rejection holds.
5. RSI:
RSI is below 50, suggesting bearish momentum, but not oversold—still room to move down.
Mr SMC Trading point
---
Conclusion & Trade Idea
Bias: Bearish
Sell Zone: Near the resistance area (0.65000–0.65150)
Target: 0.63700 zone
Stop Loss: Likely above 0.65200 (above resistance and EMA 200)
Confirmation: Price action forming lower highs and staying below EMA 200
Please support boost 🚀 this analysis)
Technical analysis of AUD/USD (Australian Dollar / U.S. Dollar) on the 4-hour timeframe, with a likely setup for further downside. Here's a breakdown of the idea:
---
Technical Summary
Pair: AUD/USD
Timeframe: 4H
Current Price: 0.64688
EMA 200: 0.65140 (price is below = bearish bias)
RSI (14): 48.23 (neutral to slightly bearish)
--
Key Observations
1. Break of Trendline:
The previous ascending trendline (black) was broken to the downside.
This indicates a shift in market structure from bullish to bearish.
2. Resistance Rejection Zone:
Price recently retested a strong supply/resistance zone (yellow box near 0.65140) and was rejected.
This aligns with the 200 EMA → strong confluence for a sell setup.
3. Market Structure:
Price is forming lower highs, indicating sellers are gaining control.
The chart shows a projection of a bearish continuation pattern (zig-zag decline).
4. Target Zone:
Final target marked near 0.63700–0.63699, a previous support level.
This gives the setup a decent risk-reward ratio if the rejection holds.
5. RSI:
RSI is below 50, suggesting bearish momentum, but not oversold—still room to move down.
Mr SMC Trading point
---
Conclusion & Trade Idea
Bias: Bearish
Sell Zone: Near the resistance area (0.65000–0.65150)
Target: 0.63700 zone
Stop Loss: Likely above 0.65200 (above resistance and EMA 200)
Confirmation: Price action forming lower highs and staying below EMA 200
Please support boost 🚀 this analysis)
Trade active
(Services:✔️ JOIN Telegram channel
t.me/SMCTrading_point
Gold trading signals 🚀 99%
t.me/SMCTrading_point
Join my recommended broker , link 👇
World best broker exness ✅D
one.exnesstrack.org/a/l1t1rf3p6v
t.me/SMCTrading_point
Gold trading signals 🚀 99%
t.me/SMCTrading_point
Join my recommended broker , link 👇
World best broker exness ✅D
one.exnesstrack.org/a/l1t1rf3p6v
Related publications
Disclaimer
The information and publications are not meant to be, and do not constitute, financial, investment, trading, or other types of advice or recommendations supplied or endorsed by TradingView. Read more in the Terms of Use.