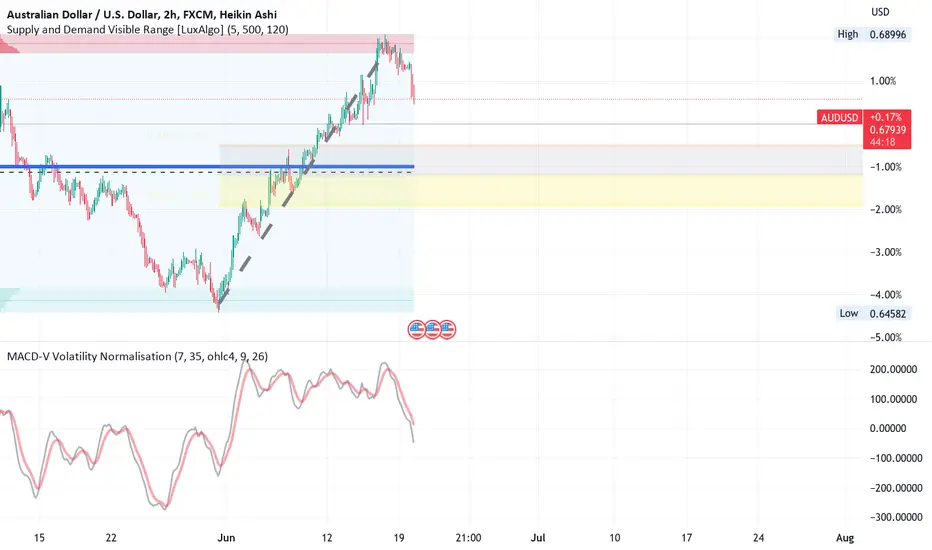
UADUSD rose over 6% since the end of May. Can it go higher? Analysis on the 2H chart suggests
that it cannot. It is presently deep in the resistance/demand zone as delineated by the
luxalgo indicator. A long mult-session volume profile shows the high volume area fairly s
symmetrical about a POC line which roughly corresponds to a 50% Fibonacci retracement of
the uptrend which occurred from May 31st to June 16th. On the MACD the lines have crossed
and are trending down. I can easily conclude that the pair is likely to retrace. I will take a
short selling forex trade.
Disclaimer
The information and publications are not meant to be, and do not constitute, financial, investment, trading, or other types of advice or recommendations supplied or endorsed by TradingView. Read more in the Terms of Use.
Disclaimer
The information and publications are not meant to be, and do not constitute, financial, investment, trading, or other types of advice or recommendations supplied or endorsed by TradingView. Read more in the Terms of Use.