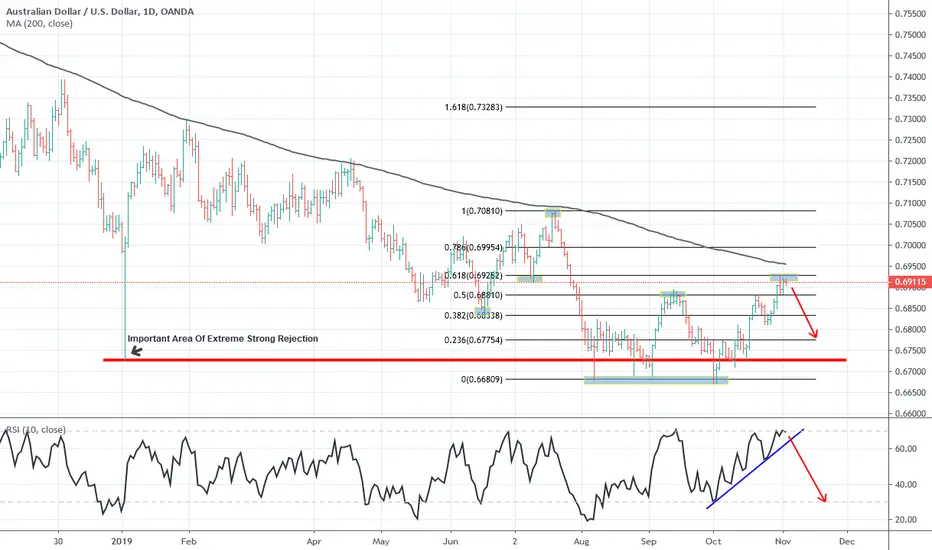
Technically we do not have a signal to sell according to candlestick analysis. If you sold this right now , the only evidence that you have to support the sell is that price is below the 200 day moving average , finished a big push up and stalled out ... and that it is at a level of resistance! HOWEVER, I See this as a big sell on the daily chart that will have pullbacks and fall more!
In order to enter safely , please enter on a moving average crossover on Hour 1 of the 10 and 20 Simple Moving Averages!
There is also hour 4 RSI Divergence as well! Please check out the areas where profits were taken in the past and look where price is now! I highlighted them on the chart!
In order to enter safely , please enter on a moving average crossover on Hour 1 of the 10 and 20 Simple Moving Averages!
There is also hour 4 RSI Divergence as well! Please check out the areas where profits were taken in the past and look where price is now! I highlighted them on the chart!
Disclaimer
The information and publications are not meant to be, and do not constitute, financial, investment, trading, or other types of advice or recommendations supplied or endorsed by TradingView. Read more in the Terms of Use.
Disclaimer
The information and publications are not meant to be, and do not constitute, financial, investment, trading, or other types of advice or recommendations supplied or endorsed by TradingView. Read more in the Terms of Use.