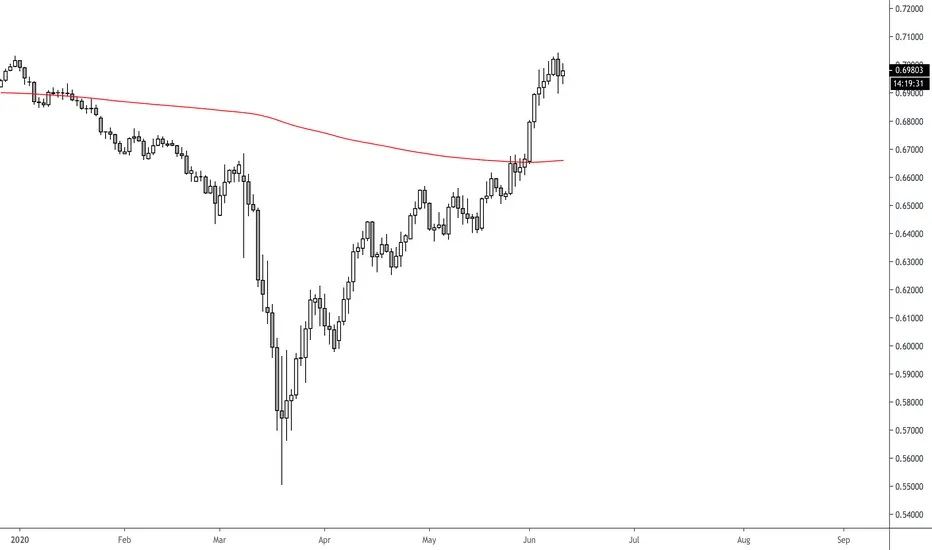
Dark Cloud Cover single candlestick pattern appearing on the daily charts.
1H charts trading in a wedge formation with the RSI showing regular bearish divergences:

Using a 15 minute chart the price action reveals a Gartley pattern formation with the RSI now showing hidden bearish divergences:


Good luck to all trading AUD/USD !
1H charts trading in a wedge formation with the RSI showing regular bearish divergences:
Using a 15 minute chart the price action reveals a Gartley pattern formation with the RSI now showing hidden bearish divergences:
Good luck to all trading AUD/USD !
Note
Here is the complete chart....Note
Disclaimer
The information and publications are not meant to be, and do not constitute, financial, investment, trading, or other types of advice or recommendations supplied or endorsed by TradingView. Read more in the Terms of Use.
Disclaimer
The information and publications are not meant to be, and do not constitute, financial, investment, trading, or other types of advice or recommendations supplied or endorsed by TradingView. Read more in the Terms of Use.