📉 Monthly Chart:
- Support at 0.6160, but no end to bearish trend.
- Consider countertrend moves carefully.
📉 Weekly Chart:
- Market near resistance, but don't miss the bigger picture.
- Be cautious with countertrend trades.
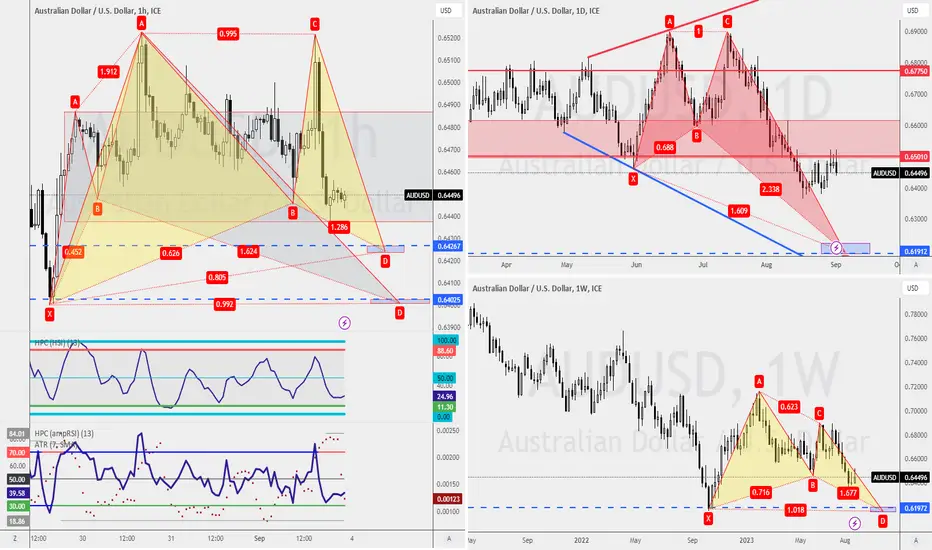
📉 Daily Chart:
- Strong bearish movement.
- Market shows weakness at previous resistance.
📉 Four-Hour & One-Hour Charts:
- Potential countertrend opportunities, but be cautious.
- Look for confirmation before engaging in trades.
💡 Trading Strategies:
- Weekly chart: Gartley pattern at 0.6173 for patient buyers.
- Daily chart: Bullish crab pattern at 0.6191 for buying opportunity.
- One-hour chart: Counter trend buying opportunity around 0.6400 if market breaks lower.
- Support at 0.6160, but no end to bearish trend.
- Consider countertrend moves carefully.
📉 Weekly Chart:
- Market near resistance, but don't miss the bigger picture.
- Be cautious with countertrend trades.
📉 Daily Chart:
- Strong bearish movement.
- Market shows weakness at previous resistance.
📉 Four-Hour & One-Hour Charts:
- Potential countertrend opportunities, but be cautious.
- Look for confirmation before engaging in trades.
💡 Trading Strategies:
- Weekly chart: Gartley pattern at 0.6173 for patient buyers.
- Daily chart: Bullish crab pattern at 0.6191 for buying opportunity.
- One-hour chart: Counter trend buying opportunity around 0.6400 if market breaks lower.
🕒 15mins workday for Young Parents
🏦 Qualify Junior Analyst within 90days
🎤 Keynote Speaker
Get into our 15mins workday community
discord.gg/AKDr9vPqH7
Live session & Trading Tips on the GO
instagram.com/raynlim/
🏦 Qualify Junior Analyst within 90days
🎤 Keynote Speaker
Get into our 15mins workday community
discord.gg/AKDr9vPqH7
Live session & Trading Tips on the GO
instagram.com/raynlim/
Disclaimer
The information and publications are not meant to be, and do not constitute, financial, investment, trading, or other types of advice or recommendations supplied or endorsed by TradingView. Read more in the Terms of Use.