🧠 Overall Context
W (Weekly): Bullish
D (Daily): Bearish
12H, 6H, 4H: Bearish
Bias: Short-term bearish retracement inside higher timeframe bullish structure.
🔍 Technical Breakdown
🔴 1. Market Structure
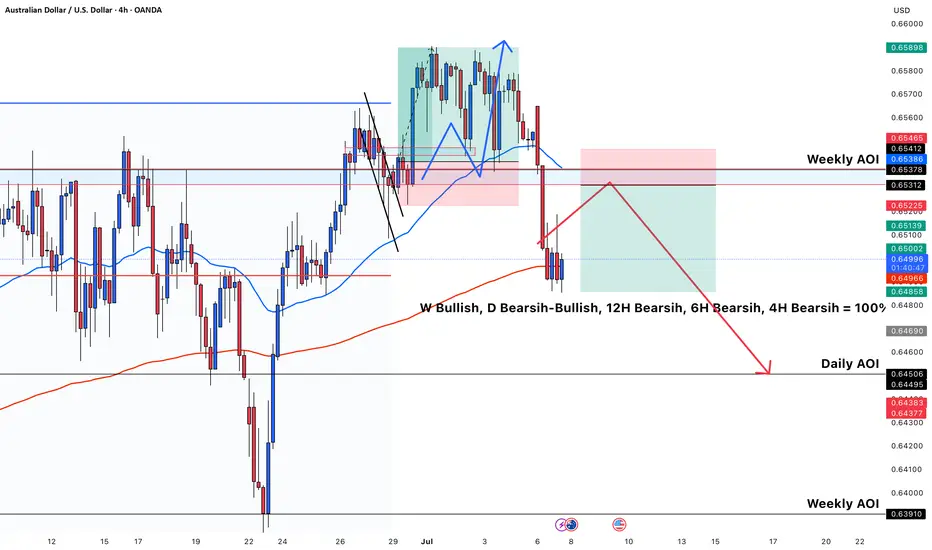
Price broke below a significant support zone (around 0.65300–0.65400), flipping it into resistance (now labeled Weekly AOI).
A bearish BOS (Break of Structure) has occurred on 4H.
Lower high formation is anticipated at the AOI (area of interest) around 0.65200–0.65400.
🔵 2. EMA Confluence
Price is now below the 50 EMA (blue) and testing the 200 EMA (red) as dynamic resistance/support.
The rejection near the 200 EMA (red) is forming consolidation, suggesting distribution before another leg down.
🟥 3. Supply Zone (Weekly AOI)
Clear supply zone rejection in red box: previous support → resistance flip.
The red rectangle represents a potential entry zone for a short, with SL above 0.65400.
🟩 4. Trade Setup
Entry: Rejection or mitigation at 0.65200–0.65400 zone (Weekly AOI).
SL: Just above the supply zone, around 0.65465.
TP: Near Daily AOI at 0.64500–0.64490, aligning with a strong demand zone from late June.
RR (Risk-Reward): Approximately 1:2 or better, depending on exact entry.
🔻 5. Projection Path
Bearish move expected after potential pullback.
Red arrow shows anticipated path: rally to Weekly AOI → rejection → continuation to Daily AOI → possible reaction at Weekly AOI below 0.6400 if sell pressure continues.
✅ Confluences for Short
HTF (4H, 6H, 12H) bearish structure.
Rejection at flipped Weekly AOI.
Bearish EMA alignment.
Clear BOS and lower-high formation.
Clean TP target at Daily AOI (logical liquidity pool).
W (Weekly): Bullish
D (Daily): Bearish
12H, 6H, 4H: Bearish
Bias: Short-term bearish retracement inside higher timeframe bullish structure.
🔍 Technical Breakdown
🔴 1. Market Structure
Price broke below a significant support zone (around 0.65300–0.65400), flipping it into resistance (now labeled Weekly AOI).
A bearish BOS (Break of Structure) has occurred on 4H.
Lower high formation is anticipated at the AOI (area of interest) around 0.65200–0.65400.
🔵 2. EMA Confluence
Price is now below the 50 EMA (blue) and testing the 200 EMA (red) as dynamic resistance/support.
The rejection near the 200 EMA (red) is forming consolidation, suggesting distribution before another leg down.
🟥 3. Supply Zone (Weekly AOI)
Clear supply zone rejection in red box: previous support → resistance flip.
The red rectangle represents a potential entry zone for a short, with SL above 0.65400.
🟩 4. Trade Setup
Entry: Rejection or mitigation at 0.65200–0.65400 zone (Weekly AOI).
SL: Just above the supply zone, around 0.65465.
TP: Near Daily AOI at 0.64500–0.64490, aligning with a strong demand zone from late June.
RR (Risk-Reward): Approximately 1:2 or better, depending on exact entry.
🔻 5. Projection Path
Bearish move expected after potential pullback.
Red arrow shows anticipated path: rally to Weekly AOI → rejection → continuation to Daily AOI → possible reaction at Weekly AOI below 0.6400 if sell pressure continues.
✅ Confluences for Short
HTF (4H, 6H, 12H) bearish structure.
Rejection at flipped Weekly AOI.
Bearish EMA alignment.
Clear BOS and lower-high formation.
Clean TP target at Daily AOI (logical liquidity pool).
Disclaimer
The information and publications are not meant to be, and do not constitute, financial, investment, trading, or other types of advice or recommendations supplied or endorsed by TradingView. Read more in the Terms of Use.
Disclaimer
The information and publications are not meant to be, and do not constitute, financial, investment, trading, or other types of advice or recommendations supplied or endorsed by TradingView. Read more in the Terms of Use.