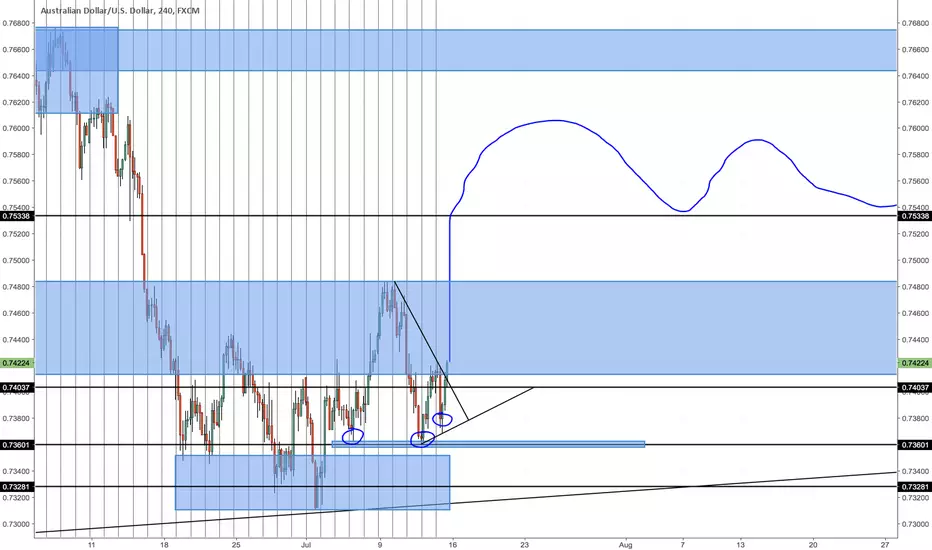
Looking at previous structure of price for AUD/USD I have marked on this chart
my higher highs, higher lows for previous bull trend as well as lower lows and lower highs for bear trends (D & 4H) with the rectangle blue boxes
January 15 2016 prices reached a low at 0.6829
deep re-tracement a few months later May 2015 20-June 02 Price retraced at 0.7163 never breaking the previous support
later that year price also retested that same support level in December 20 2016 - January 3 2017 then began its bullish trend again
Current - Price has rejected breaking a strong level of support 0.7328
waiting for a retest of the 0.7360 price before looking to go long on this trade
my bullish trend line is still valid
Disclaimer
The information and publications are not meant to be, and do not constitute, financial, investment, trading, or other types of advice or recommendations supplied or endorsed by TradingView. Read more in the Terms of Use.
Disclaimer
The information and publications are not meant to be, and do not constitute, financial, investment, trading, or other types of advice or recommendations supplied or endorsed by TradingView. Read more in the Terms of Use.