Chart
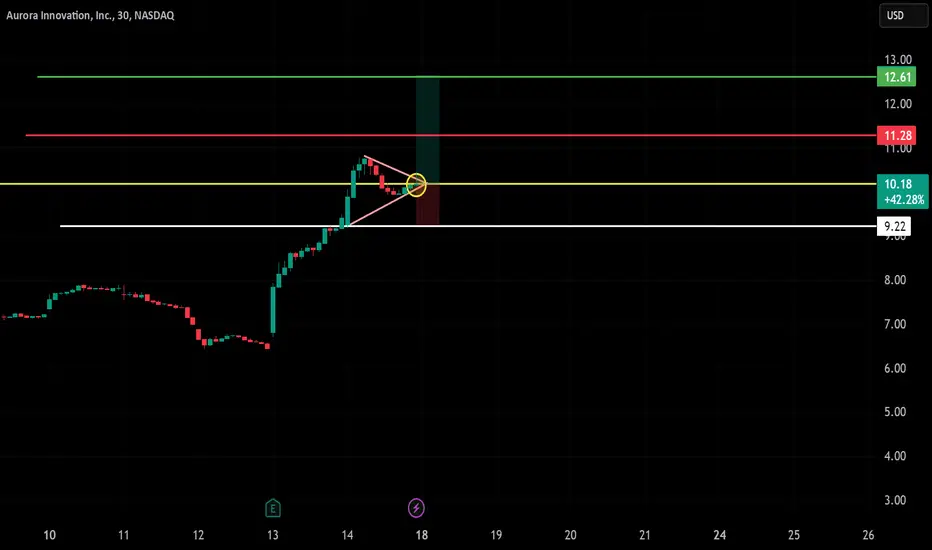
🔹 Asset: Aurora Innovation Inc. (AUR)
🔹 Timeframe: 30-Min Chart
🔹 Setup Type: Bullish Pennant Breakout
🚀 Trade Plan (Long Position):
✅ Entry Zone: $10.18 (Breakout Confirmation)
✅ Stop-Loss (SL): $9.22 (Below Support)
🎯 Take Profit Targets (Long Trade):
📌 TP1: $11.28 (First Resistance)
📌 TP2: $12.61 (Extended Bullish Target)
📊 Risk-Reward Ratio Calculation:
📈 Risk (Stop-Loss Distance):
$10.18 - $9.22 = $0.96
📈 Reward to TP1:
$11.28 - $10.18 = $1.10
💰 Risk-Reward Ratio to TP1: 1:1.14
📈 Reward to TP2:
$12.61 - $10.18 = $2.43
💰 Risk-Reward Ratio to TP2: 1:2.53
🔍 Technical Analysis & Strategy:
📌 Breakout Confirmation: A sustained move above $10.18 signals further upside.
📌 Pattern Formation: Bullish Pennant formation, indicating momentum continuation.
📊 Key Support & Resistance Levels:
🟢 $9.22 (Strong Support / SL Level)
🟡 $10.18 (Breakout Zone / Entry)
🔴 $11.28 (First Profit Target / Resistance)
🟢 $12.61 (Final Target for Momentum Extension)
🚀 Momentum Shift Expected:
If price holds above $10.18, potential move towards $11.28 and $12.61.
A high-volume breakout would confirm trend continuation.
🔥 Trade Execution & Risk Management:
📊 Volume Confirmation: Ensure strong buying volume above $10.18.
📈 Trailing Stop Strategy: Move SL to entry ($10.18) after TP1 ($11.28) is hit.
💰 Partial Profit Booking Strategy:
✔ Take 50% profits at $11.28, let the rest run to $12.61.
✔ Adjust Stop-Loss to Break-even ($10.18) after TP1 is reached.
⚠️ Fake Breakout Risk:
If price drops below $10.18, wait for a retest before considering re-entry.
🚀 Final Thoughts:
✔ Bullish Setup – If price sustains above $10.18, higher targets are likely.
✔ Momentum Shift Possible – Watch for volume confirmation.
✔ Favorable Risk-Reward Ratio – 1:1.14 to TP1, 1:2.53 to TP2.
💡 Stick to the plan, manage risk, and trade smart! 🚀🏆
🔗 #StockTrading #AUR #BreakoutTrade #TechnicalAnalysis #MarketTrends #ProfittoPath
Disclaimer
The information and publications are not meant to be, and do not constitute, financial, investment, trading, or other types of advice or recommendations supplied or endorsed by TradingView. Read more in the Terms of Use.
Disclaimer
The information and publications are not meant to be, and do not constitute, financial, investment, trading, or other types of advice or recommendations supplied or endorsed by TradingView. Read more in the Terms of Use.