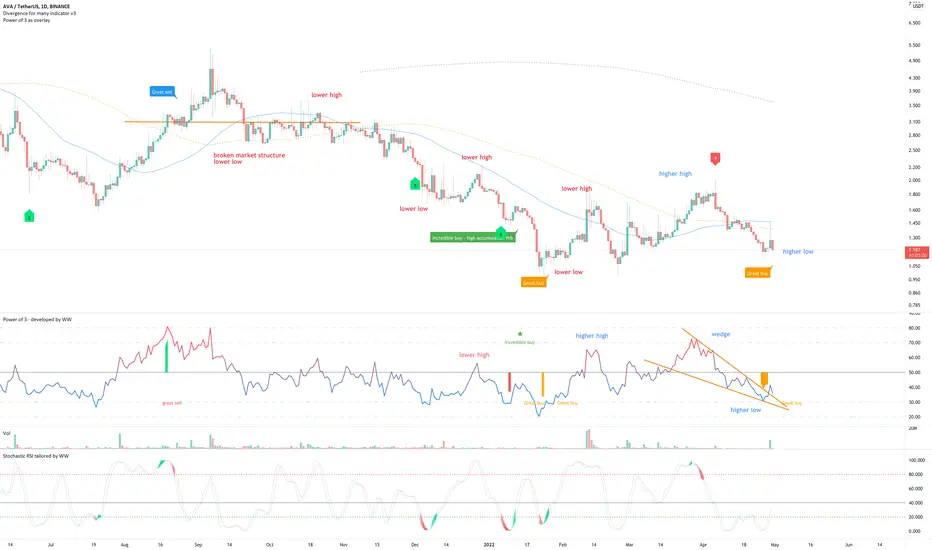
On the above 1-day chart price action has corrected over 80% since last April. Now is an excellent moment to take a long position. Why?
1) The ‘incredible buy’ signal. Also prints on 6-day chart (below) following the previous sell signal.
2) Trend reversal. Price action AND RSI are now printing higher highs / higher lows. Excellent.
Is it possible price action falls further? For sure.
Is it probable? No.
Timeframe: 2-4 months
Projected return: 6 to 10x
Portfolio exposure < 6%
Good luck!
Ww
6-day buy signal
Trade active
Trade active
The madness of alt season is upon usTrade active
Note
nowBTC
bc1q2eckdzh0q8vsd7swcc8et6ze7s99khhxyl7zwy
Weblink: patreon.com/withoutworries
Allow 3-6 months on ideas. Not investment advice. DYOR
bc1q2eckdzh0q8vsd7swcc8et6ze7s99khhxyl7zwy
Weblink: patreon.com/withoutworries
Allow 3-6 months on ideas. Not investment advice. DYOR
Disclaimer
The information and publications are not meant to be, and do not constitute, financial, investment, trading, or other types of advice or recommendations supplied or endorsed by TradingView. Read more in the Terms of Use.
BTC
bc1q2eckdzh0q8vsd7swcc8et6ze7s99khhxyl7zwy
Weblink: patreon.com/withoutworries
Allow 3-6 months on ideas. Not investment advice. DYOR
bc1q2eckdzh0q8vsd7swcc8et6ze7s99khhxyl7zwy
Weblink: patreon.com/withoutworries
Allow 3-6 months on ideas. Not investment advice. DYOR
Disclaimer
The information and publications are not meant to be, and do not constitute, financial, investment, trading, or other types of advice or recommendations supplied or endorsed by TradingView. Read more in the Terms of Use.