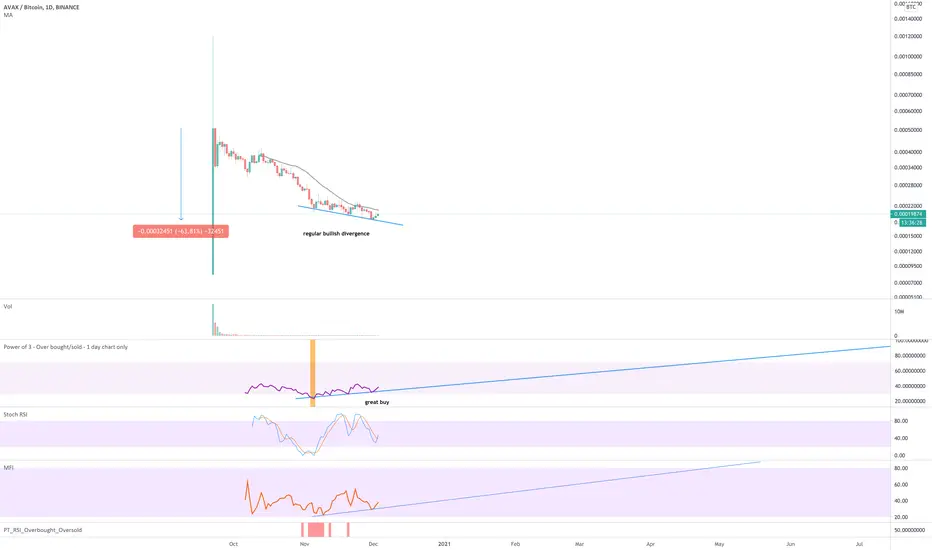
Following a 60% correction and oversold condition (orange column) the above 1-day chart is showing a reversal in price action is probable.
Regular bullish divergence between price action and the oscillators together with increasing volume (It is there just not visible on this scale!) and Stochastic RSI crossing up is a very bullish signal.
Can price action fall further? Sure.
Is it probable? Unlikely.
One noteworthy observation are the resistance levels on the way back up, there are not many, so it should be exciting to see where this goes.
Trade closed manually
Price action is now overbought and has become a 'great sell' opportunity. Price action could continue to climb no doubt of that. The probability that it does is now less than the risk of a correction taking away all those profits.Look for support on the 21-day EMA before going long again.
Trade active
A little bit of history repeating Trade active
BTC
bc1q2eckdzh0q8vsd7swcc8et6ze7s99khhxyl7zwy
Weblink: patreon.com/withoutworries
Allow 3-6 months on ideas. Not investment advice. DYOR
bc1q2eckdzh0q8vsd7swcc8et6ze7s99khhxyl7zwy
Weblink: patreon.com/withoutworries
Allow 3-6 months on ideas. Not investment advice. DYOR
Disclaimer
The information and publications are not meant to be, and do not constitute, financial, investment, trading, or other types of advice or recommendations supplied or endorsed by TradingView. Read more in the Terms of Use.