Analysis provided based on market conditions as of May 23, 2025, at 17:56:48 New York time.
Section 0: Instant Trading Signal
Symbol: AVAX-USD
Trade Direction: Sell
Suggested Entry Range: 23.80 - 23.90 (wait for retracement)
Stop Loss: 24.05
Main Target(s): 23.15 and 22.34
Very Short Note: Entry is conditional upon price returning to the entry range, medium risk, pay attention to time and price confluence.
Section 1: Title and Quick Summary
Live AVAX/USD Analysis: Sell Opportunity on a Pullback to Target Lower Liquidity?
Symbol and Probable Direction: AVAX-USD / Sell
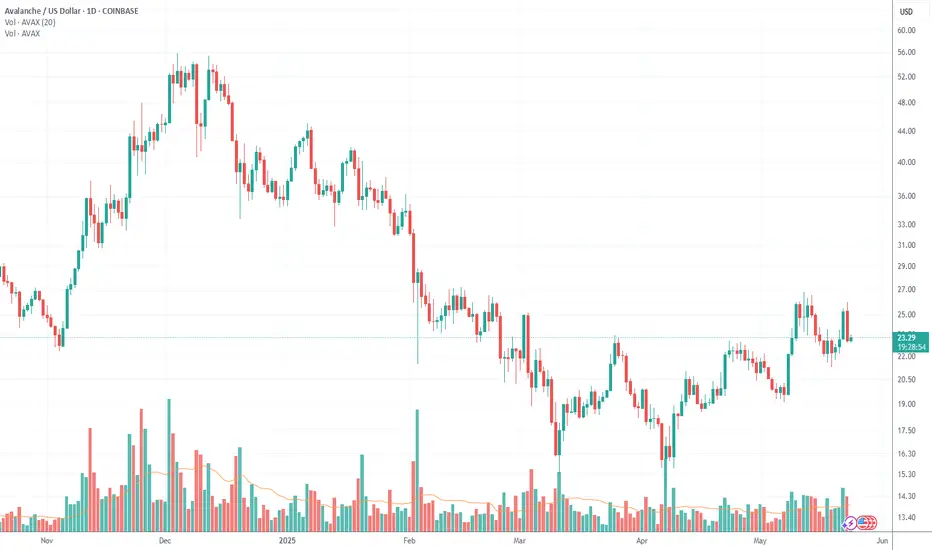
Current Situation Simply Put: Based on the analysis on May 23, 2025, at 17:56:48 New York time, the AVAX/USD market shows an uptrend on the daily timeframe but with a recent significant downward move, and it is in a ranging phase on the 4-hour timeframe. On lower timeframes (1-hour, 15-minute, and 5-minute), the order flow is clearly bearish, and the price is targeting lower liquidity levels. After a recent sharp downward move, the price is currently near short-term support levels and may have an upward pullback (Retracement) before continuing its downward move.
Section 2: Proposed Trading Setup
Trade Direction: Sell
Precise Entry Range: Entry is suggested within the 23.80 - 23.90 range. This range is near the center (CE - Consequent Encroachment) and the upper part of a Bearish FVG (Fair Value Gap) on the 4-hour timeframe (23.66 - 23.93), which formed after the recent strong downward move. This area can act as a Discount zone for sell-side traders. We expect the price, after testing the current lower levels, to pull back to this area to continue its downward move. A more precise entry after observing LTF (Lower Time Frame) confirmation (such as a bearish break of structure and formation of a new FVG) on the 5-minute or 1-minute timeframe if the price reaches the 23.80 - 23.90 range can reduce risk, but the main setup is defined based on the 4-hour zone.
Stop Loss: 24.05. This level is just above the 4-hour FVG (23.66 - 23.93) and above the last significant Swing High before the creation of this FVG on the 4-hour timeframe. A decisive break of this level invalidates the entry scenario based on this FVG.
Price Targets:
First Target: 23.15 (PDL or Previous Daily Low). This is the first significant liquidity level identified on the daily and 1-hour timeframes and is the first logical target for profit-taking after entry.
Second Target: 22.34 (SL or significant Swing Low on the daily timeframe). This is a more significant and lower liquidity level that could be the next price target, especially considering the PWL (Probable Weekly Low) of 21.27 nearby. Estimated Timeframe to Reach Targets: Given that the time is May 23, 2025, 17:56:48 New York time, which is late in the New York session and the beginning of the Asia session, movement towards the targets may be slower. We expect the main move to occur during the London or New York sessions of the next trading day (May 24, 2025). Reaching the first target might take an estimated 12-24 hours, and the second target 24-48 hours, conditional upon the entry point being activated.
Confidence Level in the Setup: Medium.
Justification: The alignment of the bearish trend on lower timeframes and the targeting of lower liquidity are positive factors. The presence of a 4-hour FVG above the current price provides a logical entry zone. However, the daily trend is still identified as bullish (albeit weak), and the quality of recent structural breaks on lower timeframes has been average and not accompanied by strong FVGs. Also, the setup is contingent on a pullback to the entry range.
ICT Entry Model and Main Logic: This setup is based on a combination of Market Structure analysis, Liquidity, and the use of PD Arrays (FVG) on different timeframes. After a bearish break of structure on lower timeframes and the creation of a bearish order flow, we expect the price to pull back to a Premium area or an Inefficiency zone like the 4-hour FVG to gather more sell orders. Entering in this zone (within a relative OTE - Optimal Trade Entry - for the recent downward move) with a logical stop loss above the invalidation point allows for targeting liquidity at lower levels (PDL and SL/PWL) with a favorable risk-to-reward ratio.
Setup Validity: This setup is valid as long as the price does not reach the stop loss at 24.05. Also, if the price reaches the first or second targets without a significant pullback, the validity of the setup for a new entry decreases.
Special Precautionary Notes: Avoid emotional entry at the current price; wait for a pullback to the 23.80 - 23.90 range. Refrain from trading during major economic news releases (if any in the coming days). Due to the average quality of recent BOS (Break of Structure) on LTF, manage your position size.
Section 3: Why the Analysis and a Deeper ICT Look
Higher Timeframe In-depth Analysis: On the daily timeframe (1D), the overall market trend is identified as bullish, but this trend has entered a mid-term corrective or bearish phase after price highs (like 55.84 and 30.85). The last bullish Break of Structure (BOS) on the daily had average quality (4.7/10) and was not accompanied by the creation of an FVG, indicating not-so-strong buyer power at that point. Currently, the price on the 4-hour timeframe (4H) is in a ranging phase, but the recent move downwards from the 26.82 high indicates seller dominance in this area. The market narrative from an ICT perspective is that after a distribution phase at higher tops, the price is now collecting liquidity at lower levels in a corrective phase or the beginning of a larger bearish move, even if the daily trend has not officially changed yet. Key pivots like 22.34 (Daily SL) and 21.27 (PWL) are important targets for the Interbank Price Delivery Algorithm (IPDA). The current price, as of May 23, 2025, at 17:56:48 New York time, is near the bottom of the recent 4-hour trading range.
(Very Important) Reference to Previous Analysis: No prior analysis has been provided for the AVAX-USD symbol, so this analysis is our first assessment of the current state of this asset based on ICT principles.
Entry Timeframe Analysis: On the 1-hour (1H), 15-minute (15min), and 5-minute (5min) timeframes, the market structure has clearly turned Bearish, and bearish Breaks of Structure (BOS) have been repeated, although the quality of these BOS (score around 5/10) and the lack of strong FVG creation immediately after the breaks indicate a lack of strong momentum in each bearish wave. However, the dominant order flow on these timeframes is bearish, and the price is targeting lower internal and external liquidity levels. At the current time, May 23, 2025, at 17:56:48 New York time, the Asia session is active. Sharp moves often occur during the London or New York sessions, so expecting a pullback during the Asia session and the main move in subsequent sessions is more logical. The suggested entry range of 23.80 - 23.90 is based on the 4-hour FVG, which is a significant inefficiency area in the path of the recent downward move and could be ideal for re-entry for sell-side traders after a pullback.
Main Confluences:
Dominant bearish order flow on lower timeframes (1-hour, 15-minute, 5-minute).
Targeting significant liquidity levels below the current price (PDL 23.15 and SL 22.34).
Existence of a 4-hour FVG (23.66 - 23.93) as a potential pullback area for sellers to re-enter.
Price position in the lower part of the 4-hour trading range and approaching important targets.
Invalidation Conditions and Alternative Scenario: The main scenario (sell after pullback) is invalidated if the price reaches the stop loss at 24.05. In this case, the price will likely intend to fill higher inefficiencies or target liquidity above recent swing highs (like PDH 25.43 or 25.97). If the price reaches the lower liquidity levels (first and second targets) without a significant pullback, the sell setup based on this entry point will no longer be valid, and planning for a new setup at lower levels (e.g., based on testing a lower OTE or reacting to the 22.34 liquidity) will be necessary.
Section 4: Educational Tip or Small Exercise
ICT Educational Tip of the Week: The importance of combining timeframes and following institutional order flow. As we saw in the AVAX/USD analysis, even if the overall trend on a very high timeframe (daily) is bullish, examining mid-term (4-hour) and lower (1-hour, 15-minute, 5-minute) timeframes can indicate a change in order flow in the short and medium term. Observing Breaks of Structure (BOS) and following the path price takes to collect liquidity helps us predict the probable direction of the next move and find entry zones (PD Arrays) in the direction of the dominant order flow on the entry timeframe. Always try to align your bias with the institutional order flow on the main timeframes.
Exercise for You: On the AVAX/USD chart, identify the 4-hour FVG range (23.66 - 23.93). Also, mark the liquidity levels PDL 23.15 and SL 22.34. Monitor the price movement in the coming hours and days. Does the price pull back to the 4-hour FVG? If it pulls back, what reaction do you observe on the 5-minute or 1-minute timeframe in this area (e.g., CHoCH - Change of Character - and bearish FVG)? Does the price succeed in targeting the lower liquidity levels? This exercise will help you better understand how to use PD Arrays and liquidity levels alongside market structure analysis.
Section 5: Risk Management and Disclaimer
Risk Management Warning and Disclaimer: Trading in financial markets involves significant risk and may result in the loss of your capital. The analysis and signals provided are purely for educational and analytical purposes and are by no means financial advice or definitive trading signals. The final decision to enter any trade, determine position size, stop loss, and targets is your own responsibility. Always use appropriate risk management (such as determining position size based on a small percentage of your capital per trade) and only trade with capital you can afford to lose. The responsibility for any profit or loss resulting from the use of this analysis lies with the individual trader.
Section 0: Instant Trading Signal
Symbol: AVAX-USD
Trade Direction: Sell
Suggested Entry Range: 23.80 - 23.90 (wait for retracement)
Stop Loss: 24.05
Main Target(s): 23.15 and 22.34
Very Short Note: Entry is conditional upon price returning to the entry range, medium risk, pay attention to time and price confluence.
Section 1: Title and Quick Summary
Live AVAX/USD Analysis: Sell Opportunity on a Pullback to Target Lower Liquidity?
Symbol and Probable Direction: AVAX-USD / Sell
Current Situation Simply Put: Based on the analysis on May 23, 2025, at 17:56:48 New York time, the AVAX/USD market shows an uptrend on the daily timeframe but with a recent significant downward move, and it is in a ranging phase on the 4-hour timeframe. On lower timeframes (1-hour, 15-minute, and 5-minute), the order flow is clearly bearish, and the price is targeting lower liquidity levels. After a recent sharp downward move, the price is currently near short-term support levels and may have an upward pullback (Retracement) before continuing its downward move.
Section 2: Proposed Trading Setup
Trade Direction: Sell
Precise Entry Range: Entry is suggested within the 23.80 - 23.90 range. This range is near the center (CE - Consequent Encroachment) and the upper part of a Bearish FVG (Fair Value Gap) on the 4-hour timeframe (23.66 - 23.93), which formed after the recent strong downward move. This area can act as a Discount zone for sell-side traders. We expect the price, after testing the current lower levels, to pull back to this area to continue its downward move. A more precise entry after observing LTF (Lower Time Frame) confirmation (such as a bearish break of structure and formation of a new FVG) on the 5-minute or 1-minute timeframe if the price reaches the 23.80 - 23.90 range can reduce risk, but the main setup is defined based on the 4-hour zone.
Stop Loss: 24.05. This level is just above the 4-hour FVG (23.66 - 23.93) and above the last significant Swing High before the creation of this FVG on the 4-hour timeframe. A decisive break of this level invalidates the entry scenario based on this FVG.
Price Targets:
First Target: 23.15 (PDL or Previous Daily Low). This is the first significant liquidity level identified on the daily and 1-hour timeframes and is the first logical target for profit-taking after entry.
Second Target: 22.34 (SL or significant Swing Low on the daily timeframe). This is a more significant and lower liquidity level that could be the next price target, especially considering the PWL (Probable Weekly Low) of 21.27 nearby. Estimated Timeframe to Reach Targets: Given that the time is May 23, 2025, 17:56:48 New York time, which is late in the New York session and the beginning of the Asia session, movement towards the targets may be slower. We expect the main move to occur during the London or New York sessions of the next trading day (May 24, 2025). Reaching the first target might take an estimated 12-24 hours, and the second target 24-48 hours, conditional upon the entry point being activated.
Confidence Level in the Setup: Medium.
Justification: The alignment of the bearish trend on lower timeframes and the targeting of lower liquidity are positive factors. The presence of a 4-hour FVG above the current price provides a logical entry zone. However, the daily trend is still identified as bullish (albeit weak), and the quality of recent structural breaks on lower timeframes has been average and not accompanied by strong FVGs. Also, the setup is contingent on a pullback to the entry range.
ICT Entry Model and Main Logic: This setup is based on a combination of Market Structure analysis, Liquidity, and the use of PD Arrays (FVG) on different timeframes. After a bearish break of structure on lower timeframes and the creation of a bearish order flow, we expect the price to pull back to a Premium area or an Inefficiency zone like the 4-hour FVG to gather more sell orders. Entering in this zone (within a relative OTE - Optimal Trade Entry - for the recent downward move) with a logical stop loss above the invalidation point allows for targeting liquidity at lower levels (PDL and SL/PWL) with a favorable risk-to-reward ratio.
Setup Validity: This setup is valid as long as the price does not reach the stop loss at 24.05. Also, if the price reaches the first or second targets without a significant pullback, the validity of the setup for a new entry decreases.
Special Precautionary Notes: Avoid emotional entry at the current price; wait for a pullback to the 23.80 - 23.90 range. Refrain from trading during major economic news releases (if any in the coming days). Due to the average quality of recent BOS (Break of Structure) on LTF, manage your position size.
Section 3: Why the Analysis and a Deeper ICT Look
Higher Timeframe In-depth Analysis: On the daily timeframe (1D), the overall market trend is identified as bullish, but this trend has entered a mid-term corrective or bearish phase after price highs (like 55.84 and 30.85). The last bullish Break of Structure (BOS) on the daily had average quality (4.7/10) and was not accompanied by the creation of an FVG, indicating not-so-strong buyer power at that point. Currently, the price on the 4-hour timeframe (4H) is in a ranging phase, but the recent move downwards from the 26.82 high indicates seller dominance in this area. The market narrative from an ICT perspective is that after a distribution phase at higher tops, the price is now collecting liquidity at lower levels in a corrective phase or the beginning of a larger bearish move, even if the daily trend has not officially changed yet. Key pivots like 22.34 (Daily SL) and 21.27 (PWL) are important targets for the Interbank Price Delivery Algorithm (IPDA). The current price, as of May 23, 2025, at 17:56:48 New York time, is near the bottom of the recent 4-hour trading range.
(Very Important) Reference to Previous Analysis: No prior analysis has been provided for the AVAX-USD symbol, so this analysis is our first assessment of the current state of this asset based on ICT principles.
Entry Timeframe Analysis: On the 1-hour (1H), 15-minute (15min), and 5-minute (5min) timeframes, the market structure has clearly turned Bearish, and bearish Breaks of Structure (BOS) have been repeated, although the quality of these BOS (score around 5/10) and the lack of strong FVG creation immediately after the breaks indicate a lack of strong momentum in each bearish wave. However, the dominant order flow on these timeframes is bearish, and the price is targeting lower internal and external liquidity levels. At the current time, May 23, 2025, at 17:56:48 New York time, the Asia session is active. Sharp moves often occur during the London or New York sessions, so expecting a pullback during the Asia session and the main move in subsequent sessions is more logical. The suggested entry range of 23.80 - 23.90 is based on the 4-hour FVG, which is a significant inefficiency area in the path of the recent downward move and could be ideal for re-entry for sell-side traders after a pullback.
Main Confluences:
Dominant bearish order flow on lower timeframes (1-hour, 15-minute, 5-minute).
Targeting significant liquidity levels below the current price (PDL 23.15 and SL 22.34).
Existence of a 4-hour FVG (23.66 - 23.93) as a potential pullback area for sellers to re-enter.
Price position in the lower part of the 4-hour trading range and approaching important targets.
Invalidation Conditions and Alternative Scenario: The main scenario (sell after pullback) is invalidated if the price reaches the stop loss at 24.05. In this case, the price will likely intend to fill higher inefficiencies or target liquidity above recent swing highs (like PDH 25.43 or 25.97). If the price reaches the lower liquidity levels (first and second targets) without a significant pullback, the sell setup based on this entry point will no longer be valid, and planning for a new setup at lower levels (e.g., based on testing a lower OTE or reacting to the 22.34 liquidity) will be necessary.
Section 4: Educational Tip or Small Exercise
ICT Educational Tip of the Week: The importance of combining timeframes and following institutional order flow. As we saw in the AVAX/USD analysis, even if the overall trend on a very high timeframe (daily) is bullish, examining mid-term (4-hour) and lower (1-hour, 15-minute, 5-minute) timeframes can indicate a change in order flow in the short and medium term. Observing Breaks of Structure (BOS) and following the path price takes to collect liquidity helps us predict the probable direction of the next move and find entry zones (PD Arrays) in the direction of the dominant order flow on the entry timeframe. Always try to align your bias with the institutional order flow on the main timeframes.
Exercise for You: On the AVAX/USD chart, identify the 4-hour FVG range (23.66 - 23.93). Also, mark the liquidity levels PDL 23.15 and SL 22.34. Monitor the price movement in the coming hours and days. Does the price pull back to the 4-hour FVG? If it pulls back, what reaction do you observe on the 5-minute or 1-minute timeframe in this area (e.g., CHoCH - Change of Character - and bearish FVG)? Does the price succeed in targeting the lower liquidity levels? This exercise will help you better understand how to use PD Arrays and liquidity levels alongside market structure analysis.
Section 5: Risk Management and Disclaimer
Risk Management Warning and Disclaimer: Trading in financial markets involves significant risk and may result in the loss of your capital. The analysis and signals provided are purely for educational and analytical purposes and are by no means financial advice or definitive trading signals. The final decision to enter any trade, determine position size, stop loss, and targets is your own responsibility. Always use appropriate risk management (such as determining position size based on a small percentage of your capital per trade) and only trade with capital you can afford to lose. The responsibility for any profit or loss resulting from the use of this analysis lies with the individual trader.
Disclaimer
The information and publications are not meant to be, and do not constitute, financial, investment, trading, or other types of advice or recommendations supplied or endorsed by TradingView. Read more in the Terms of Use.
Disclaimer
The information and publications are not meant to be, and do not constitute, financial, investment, trading, or other types of advice or recommendations supplied or endorsed by TradingView. Read more in the Terms of Use.