Avalanche (AVAX) technical analysis:
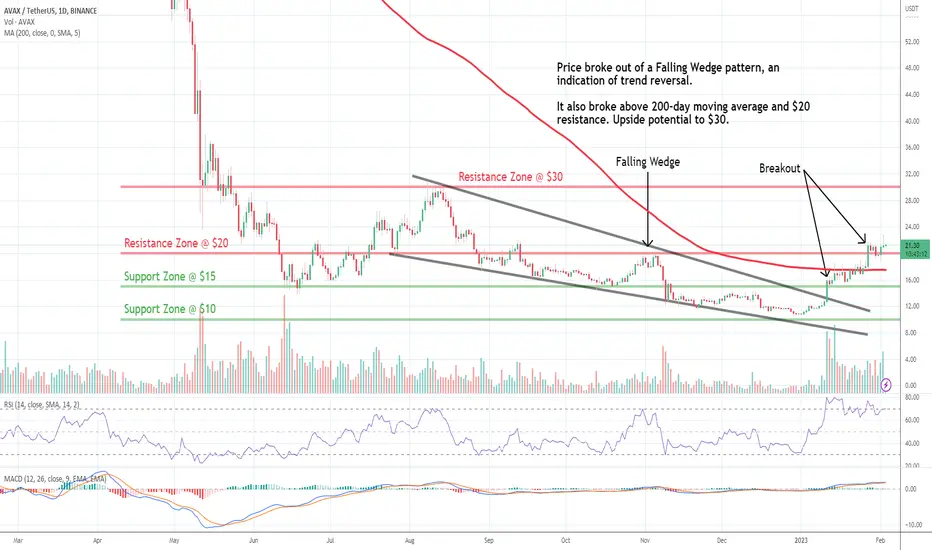
Trade setup: Price broke out of a Falling Wedge pattern with huge volume, an indication of trend reversal. It also broke above 200-day moving average and $20 resistance. Upside potential to $30. Partnership news with AWS triggered the recent rally.
Trend: Uptrend on Short- and Medium-Term basis and Neutral on Long-Term basis.
Momentum is Bullish but inflecting. MACD Line is above MACD Signal Line and RSI is above 55 but momentum may have peaked since MACD Histogram bars are declining, which suggests that momentum is weakening.
Support and Resistance: Nearest Support Zone is $15, (previous resistance), then $10. The nearest Resistance Zone is $20, which it broke, then $30.
Disclaimer
The information and publications are not meant to be, and do not constitute, financial, investment, trading, or other types of advice or recommendations supplied or endorsed by TradingView. Read more in the Terms of Use.
Disclaimer
The information and publications are not meant to be, and do not constitute, financial, investment, trading, or other types of advice or recommendations supplied or endorsed by TradingView. Read more in the Terms of Use.