Technical Analysis for AVAX/USDT Monthly
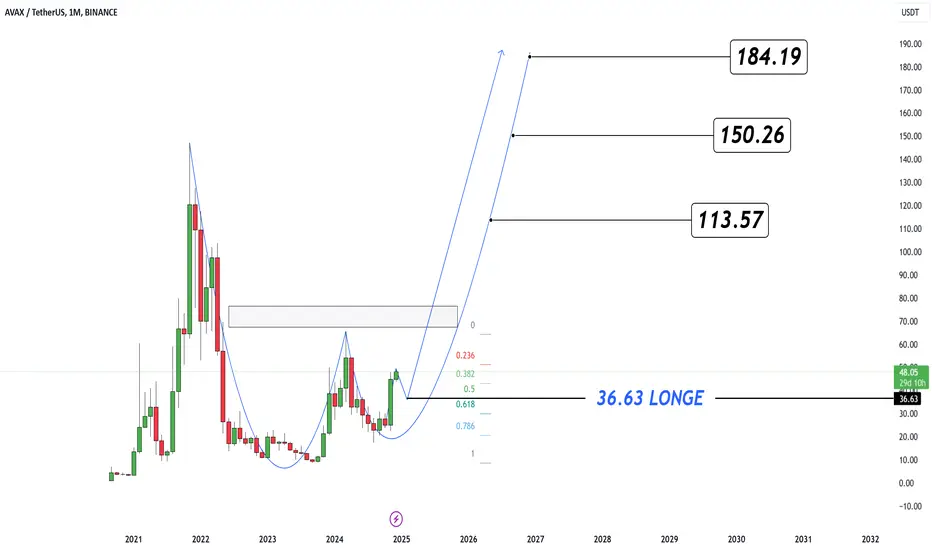
The chart highlights a Rounded Bottom pattern forming over an extended timeframe, which is a strong bullish reversal signal.
The LONGE HERE level at $36.63 aligns with the Fibonacci 0.618 retracement level, serving as a crucial support zone and an optimal entry point for long positions.
Key Levels
T1: $113.57
T2: $150.26
T3: $184.19
Subscribe to my Telegram Channel 👉 :
t.me/addlist/y5mi70s3c0Y3MDQ0
Subscribe to my X 👉 : x.com/VIPROSETR
t.me/addlist/y5mi70s3c0Y3MDQ0
Subscribe to my X 👉 : x.com/VIPROSETR
Disclaimer
The information and publications are not meant to be, and do not constitute, financial, investment, trading, or other types of advice or recommendations supplied or endorsed by TradingView. Read more in the Terms of Use.