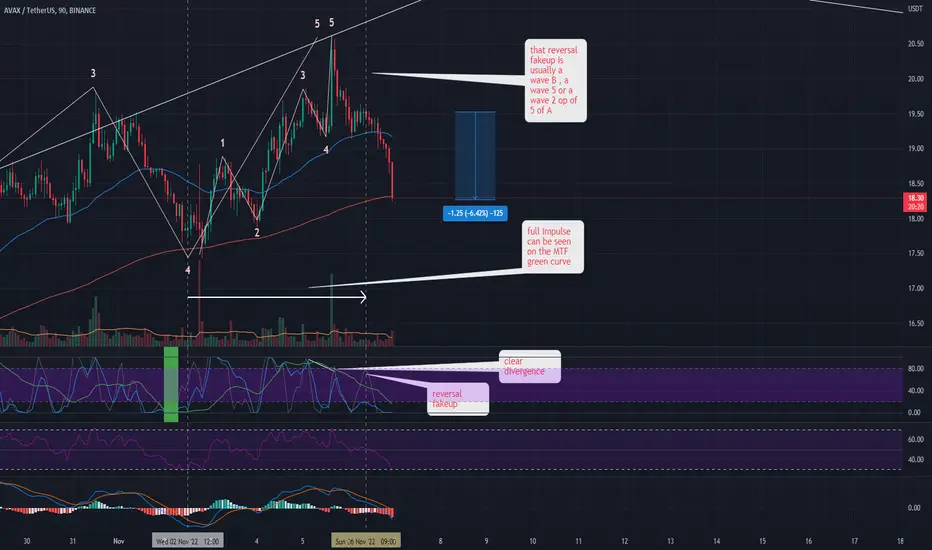
another example of how to interpret the waves with the help of the MTF wave indicator. you can see wave 5 starts with MTF being oversold. you mainly need to look at the green curve which then forms a wave up, then diverges at the top with a tap up from gray and blue time frame stochastics, followed by more green stoch wave decline as well as a clear entry for short through that last fakeup . for those who dont know, the fakeup is when gray stoch bounces up alone with a clear gap between it and the blue stoch.
Note
one thing to add, is that the beauty of it is that you would not be able to add on this last drop alone through elliot waves as that fakeup occured at the very local top which was not in a fib zone that one would have normally shorted... it often helps with very shallow retraces...For More TA join our Discord group:
discord.gg/ATBB8wnXTd
and follow me on twitter:
twitter.com/cryptoheat
and check out my videos on youtube:
youtube.com/channel/UCiiOggxpyJGL3AIRnlMeWNQ
discord.gg/ATBB8wnXTd
and follow me on twitter:
twitter.com/cryptoheat
and check out my videos on youtube:
youtube.com/channel/UCiiOggxpyJGL3AIRnlMeWNQ
Disclaimer
The information and publications are not meant to be, and do not constitute, financial, investment, trading, or other types of advice or recommendations supplied or endorsed by TradingView. Read more in the Terms of Use.
For More TA join our Discord group:
discord.gg/ATBB8wnXTd
and follow me on twitter:
twitter.com/cryptoheat
and check out my videos on youtube:
youtube.com/channel/UCiiOggxpyJGL3AIRnlMeWNQ
discord.gg/ATBB8wnXTd
and follow me on twitter:
twitter.com/cryptoheat
and check out my videos on youtube:
youtube.com/channel/UCiiOggxpyJGL3AIRnlMeWNQ
Disclaimer
The information and publications are not meant to be, and do not constitute, financial, investment, trading, or other types of advice or recommendations supplied or endorsed by TradingView. Read more in the Terms of Use.