Hello traders and investors!
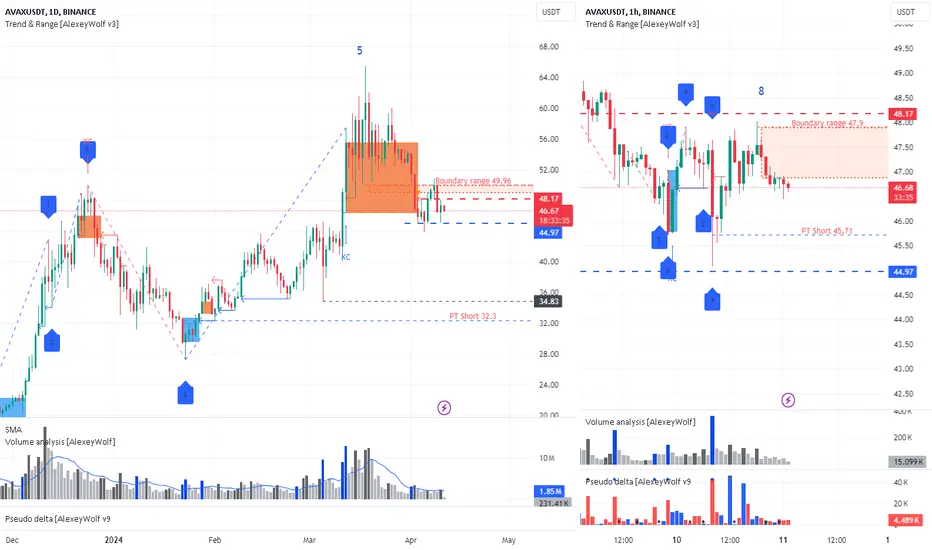
On the daily timeframe, we observe a sideways trend. The buyer's vector 4-5 has played out. The price is at the upper boundary of the sideways trend, and we can consider looking for sales as an idea to implement the seller's vector 5-6 with the first target at 40.07 (then 34.83, 32.3). After the previous review, we notice a strong resumption of the seller from the upper boundary of the sideways trend at 49.96. I anticipate that the price will test the local minimum of 44.97.
On the daily timeframe, we also see a sideways trend. The current seller's vector is 8-9 with the first target at 45.17.
It's preferable to look for sales from the upper boundary of the sideways trend on the hourly timeframe, ideally from the seller's protection level at 48.17. Alternatively, look for sales below the level of 44.97 in the absence of buyers there.
Note
The seller reached the first goal of 40.07. I'm waiting for the second goal 34.83.Note
The seller has reached their targets from the previous review - 40.07, 34.83, 32.3.On the daily timeframe, there is a sideways market, and the seller's vector 5-6 has hit the mandatory targets. In the continuation of the downtrend vector, the lower boundary of the sideways market - 27.24 can be considered as a target. I am watching the actions of the buyer, as the price is near the lower boundary of the sideways market, where there was previous buyer interest.
On the hourly timeframe, there is a downtrend. The beginning of the last seller's impulse is at 36.59. This will be the first significant resistance for the buyer.
Wishing you profitable trades!
Clarity on the Chart. Smart Trading Decisions.
No signals. Just clean structure and context t.me/user_friendly_trading
Clarity on the Chart. Smart Trading Decisions.
No signals. Just clean structure and context t.me/user_friendly_trading
Related publications
Disclaimer
The information and publications are not meant to be, and do not constitute, financial, investment, trading, or other types of advice or recommendations supplied or endorsed by TradingView. Read more in the Terms of Use.