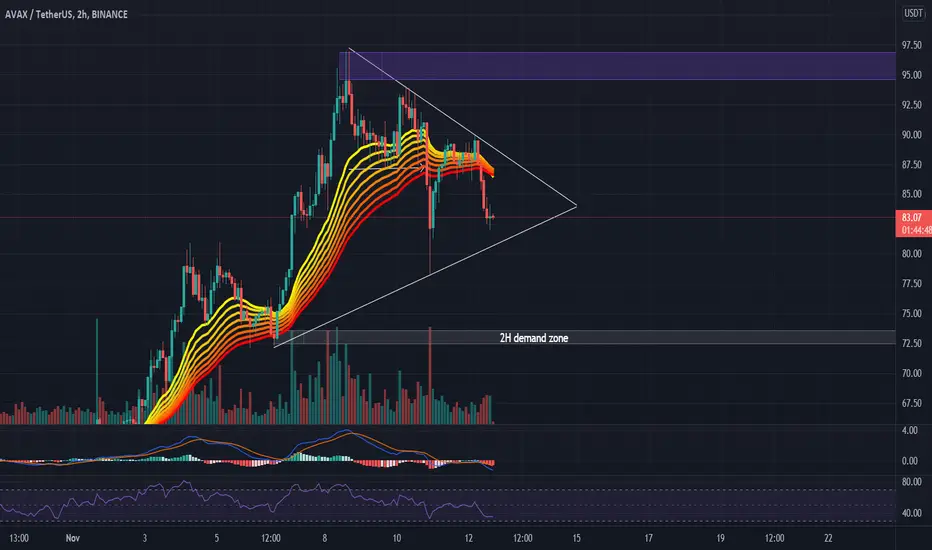
Price is ranging inside a symmetrical triangle after reaching a new ATH. MACD is now bearish, RSI is also below 50% and EMA ribbon is turning bearish. Price will either breakout from the resistance line and we would then be aiming for the highs, else it will breakout from the support line reaching the 2h demand zone at around $73 before price moves up again.
Disclaimer
The information and publications are not meant to be, and do not constitute, financial, investment, trading, or other types of advice or recommendations supplied or endorsed by TradingView. Read more in the Terms of Use.
Disclaimer
The information and publications are not meant to be, and do not constitute, financial, investment, trading, or other types of advice or recommendations supplied or endorsed by TradingView. Read more in the Terms of Use.