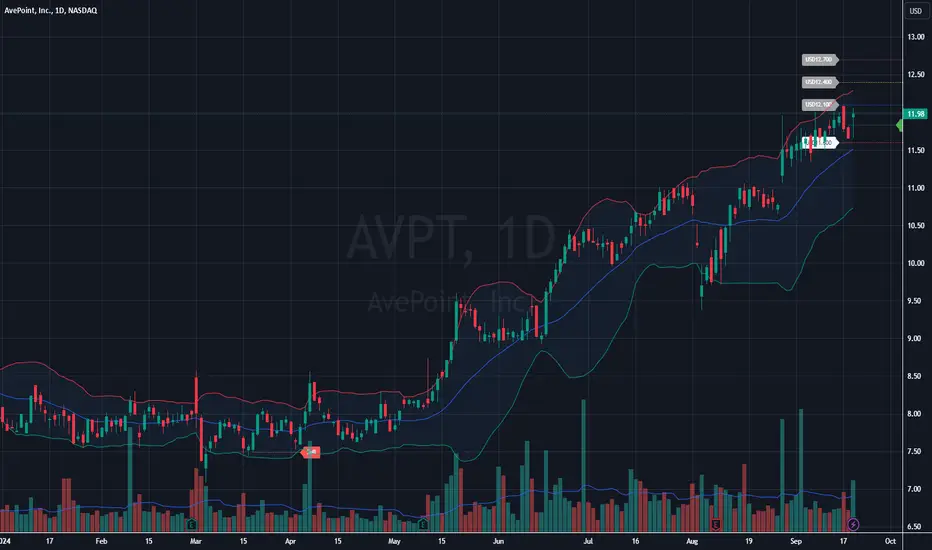
- There was a pullback recently, but the price is attempting to recover, as shown by the recent green candlestick.
- The price is currently near the upper band of the Bollinger Bands, which suggests that it might be overbought or could be nearing resistance.
- However, the overall trend remains upward, as the bands are expanding, which indicates increasing volatility and potential for further price movement.
- Resistance: The price has faced resistance near the $12.00 level, as seen by the recent small pullback. If it can break above this level, it may have room to continue higher.
- Support: Support appears to be around $11.00, where the price has found buyers in previous pullbacks.
- Bullish Case: If the price breaks above the $12.00 level with strong volume, it may continue its upward momentum, testing previous highs.
- Bearish Case: If the price cannot hold above the middle Bollinger Band or the blue moving average, a pullback towards $11.00 or even $10.50 could occur.
- This setup suggests a bullish continuation, but caution is advised near the resistance area of $12.00, as it may need more momentum or a pullback to gain strength for a breakout.
➀➁➂➃➄
Disclaimer
The information and publications are not meant to be, and do not constitute, financial, investment, trading, or other types of advice or recommendations supplied or endorsed by TradingView. Read more in the Terms of Use.
➀➁➂➃➄
Disclaimer
The information and publications are not meant to be, and do not constitute, financial, investment, trading, or other types of advice or recommendations supplied or endorsed by TradingView. Read more in the Terms of Use.