This chart of AvePoint Inc. (AVPT) shows strong bullish price action recently, but there are signals emerging that suggest a potential top may be forming or at least that we’re approaching resistance with caution warranted. Let’s break this down:
1. Price Action & Key Resistance
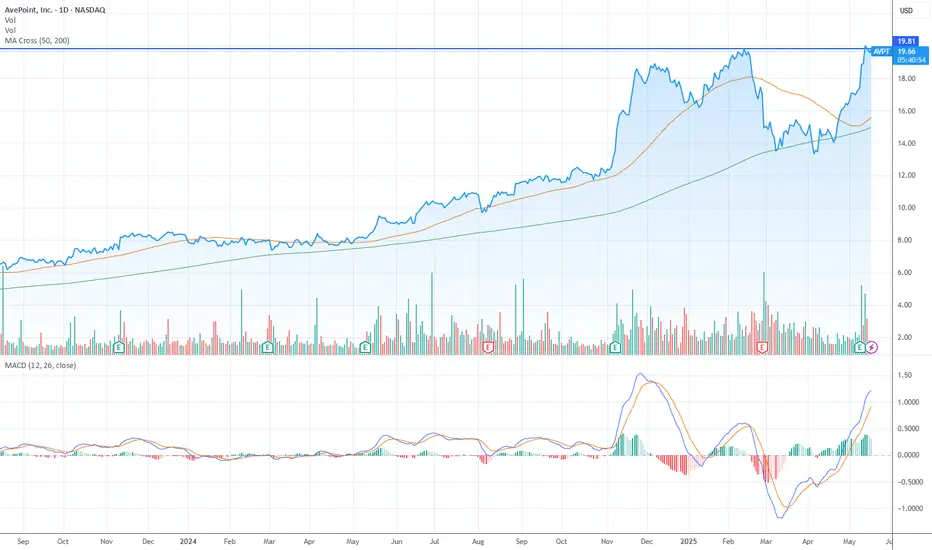
Current Price: $19.60
Horizontal Resistance: The blue line at around $19.81 marks a prior swing high — this is a psychological and technical resistance level. Price rallied sharply from the 14S to $19+, and we are right at the resistance level.
2. Moving Averages (50 / 200-day)
Golden Cross confirmed: The 50-day MA (orange) is trading above the 200-day MA (green), supporting a longer-term bullish trend. However, the price is extended above both MAs. Historically, when price stretches too far above the 50/200 MAs without consolidation, it tends to revert or stall.
3. Volume Analysis
Volume spiked on the recent rally but now appears to be fading slightly. Declining volume into resistance often signals buyer exhaustion — one of the first signs of a potential top.
4. Fibonacci Retracement
If we pull a Fibonacci retracement from the recent low (~$10 in mid-2024) to the current high: The 1.0 Fib level aligns near the $19.60–$20 zone, which matches historical resistance — confluence of resistance strengthens the top-call argument. If price reverses here, the 0.618 level (~$15–16) could be the next downside target.
5. MACD: Bearish Divergence Setup?
MACD Line (blue): 1.21, Signal Line (orange): 0.9097 — bullish crossover still active. However: MACD histogram is flattening, showing momentum slowing down. MACD peak today is lower than Dec 2024, while price is attempting to re-test the same high — that’s a bearish divergence in the making. Early warning that this momentum rally could be losing steam.
What Constitutes a Real Breakout on this one?
1. Clean Daily Close Above $19.81
Not just an intraday wick — we want a full-bodied candle close above $19.81, ideally above $20.00, to show strength and commitment. Ideally with a range expansion bar (long candle body), not a doji or spinning top.
2. Surge in Volume
Breakouts must be accompanied by volume — think 30–50%+ above average daily volume. It tells you institutions are behind the move, not just retail FOMO or weak hands.
3. Follow-through the Next Day
After the breakout, the next session should not gap and fade. You want to see continued buying or at least a tight consolidation above prior resistance (which then becomes support).
4. Momentum Confirmation (MACD, RSI)
MACD histogram expanding, not flattening. RSI breaking above 70 and holding, without bearish divergence. If MACD and RSI diverge while price breaks out, that’s a red flag (weak breakout).
5. No Immediate Rejection or Reversal
Watch for a "fake breakout" — when price spikes above resistance intraday or for one session, then closes below the level the next day. That’s a bull trap and often marks a local top.
1. Price Action & Key Resistance
Current Price: $19.60
Horizontal Resistance: The blue line at around $19.81 marks a prior swing high — this is a psychological and technical resistance level. Price rallied sharply from the
2. Moving Averages (50 / 200-day)
Golden Cross confirmed: The 50-day MA (orange) is trading above the 200-day MA (green), supporting a longer-term bullish trend. However, the price is extended above both MAs. Historically, when price stretches too far above the 50/200 MAs without consolidation, it tends to revert or stall.
3. Volume Analysis
Volume spiked on the recent rally but now appears to be fading slightly. Declining volume into resistance often signals buyer exhaustion — one of the first signs of a potential top.
4. Fibonacci Retracement
If we pull a Fibonacci retracement from the recent low (~$10 in mid-2024) to the current high: The 1.0 Fib level aligns near the $19.60–$20 zone, which matches historical resistance — confluence of resistance strengthens the top-call argument. If price reverses here, the 0.618 level (~$15–16) could be the next downside target.
5. MACD: Bearish Divergence Setup?
MACD Line (blue): 1.21, Signal Line (orange): 0.9097 — bullish crossover still active. However: MACD histogram is flattening, showing momentum slowing down. MACD peak today is lower than Dec 2024, while price is attempting to re-test the same high — that’s a bearish divergence in the making. Early warning that this momentum rally could be losing steam.
What Constitutes a Real Breakout on this one?
1. Clean Daily Close Above $19.81
Not just an intraday wick — we want a full-bodied candle close above $19.81, ideally above $20.00, to show strength and commitment. Ideally with a range expansion bar (long candle body), not a doji or spinning top.
2. Surge in Volume
Breakouts must be accompanied by volume — think 30–50%+ above average daily volume. It tells you institutions are behind the move, not just retail FOMO or weak hands.
3. Follow-through the Next Day
After the breakout, the next session should not gap and fade. You want to see continued buying or at least a tight consolidation above prior resistance (which then becomes support).
4. Momentum Confirmation (MACD, RSI)
MACD histogram expanding, not flattening. RSI breaking above 70 and holding, without bearish divergence. If MACD and RSI diverge while price breaks out, that’s a red flag (weak breakout).
5. No Immediate Rejection or Reversal
Watch for a "fake breakout" — when price spikes above resistance intraday or for one session, then closes below the level the next day. That’s a bull trap and often marks a local top.
Disclaimer
The information and publications are not meant to be, and do not constitute, financial, investment, trading, or other types of advice or recommendations supplied or endorsed by TradingView. Read more in the Terms of Use.
Disclaimer
The information and publications are not meant to be, and do not constitute, financial, investment, trading, or other types of advice or recommendations supplied or endorsed by TradingView. Read more in the Terms of Use.