Adani Wilmar (AWL) technical analysis shows mixed signals:
Bullish Signs:
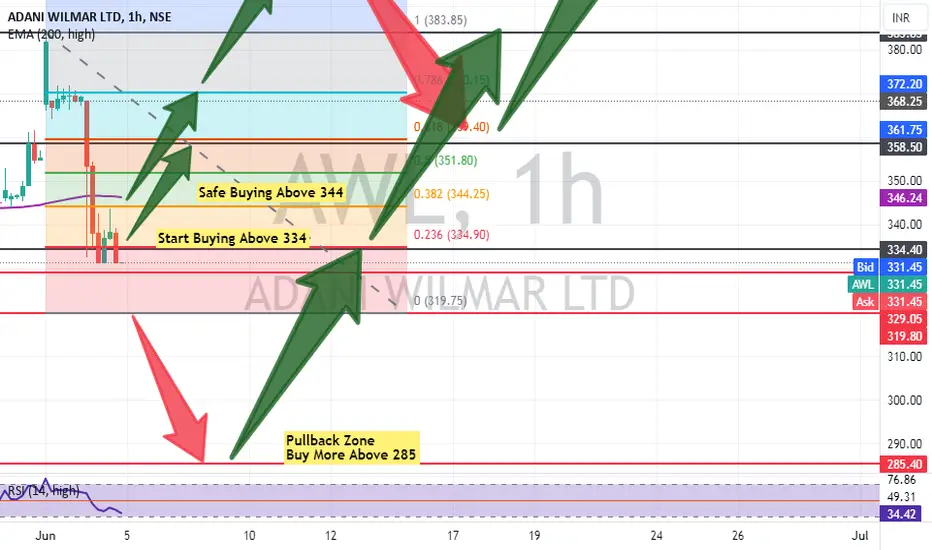
Upward trend: AWL has been trending upwards for the past few months and is currently near a six-month high.
Recent bullish reversal: Technical indicators like the Awesome Oscillator are trending upwards, suggesting a continuation of the uptrend.
Strong upward move: The stock has seen a strong price increase recently.
Bearish Signs:
Overbought indicators: Some indicators like Williams %R and Stochastic are falling from overbought levels, which could signal a potential pullback.
Volume: While the price is rising, keep an eye on volume. Lower volume during a price rise can indicate a weaker uptrend.
Overall, the technical analysis for AWL is inconclusive.
Remember, technical analysis should only be one part of your investment strategy. Consider other factors like fundamentals, market conditions, and your own risk tolerance before making any investment decisions.
My Opinion:- Overall technical analysis suggests that the trend is bullish.
Thanks for your support as always
Disclaimer: This information is for educational purposes only and shouldn't be considered financial advice. It's important to do your own research before making any investment decisions.
Bullish Signs:
Upward trend: AWL has been trending upwards for the past few months and is currently near a six-month high.
Recent bullish reversal: Technical indicators like the Awesome Oscillator are trending upwards, suggesting a continuation of the uptrend.
Strong upward move: The stock has seen a strong price increase recently.
Bearish Signs:
Overbought indicators: Some indicators like Williams %R and Stochastic are falling from overbought levels, which could signal a potential pullback.
Volume: While the price is rising, keep an eye on volume. Lower volume during a price rise can indicate a weaker uptrend.
Overall, the technical analysis for AWL is inconclusive.
Remember, technical analysis should only be one part of your investment strategy. Consider other factors like fundamentals, market conditions, and your own risk tolerance before making any investment decisions.
My Opinion:- Overall technical analysis suggests that the trend is bullish.
Thanks for your support as always
Disclaimer: This information is for educational purposes only and shouldn't be considered financial advice. It's important to do your own research before making any investment decisions.
Disclaimer
The information and publications are not meant to be, and do not constitute, financial, investment, trading, or other types of advice or recommendations supplied or endorsed by TradingView. Read more in the Terms of Use.
Disclaimer
The information and publications are not meant to be, and do not constitute, financial, investment, trading, or other types of advice or recommendations supplied or endorsed by TradingView. Read more in the Terms of Use.